DIRECT_00048


Location

lon / lat [deg]: 99.5763 / 2.631

Source network: DIRECT


Geostationary surface albedo (GSA) data


“+000”


“+057/+063”


Landcover information (based on ESA CCI landcover data)


Landcover fractions @ 2km distance


Landcover fractions @ 20 km distance


Legend


Distance to open water bodies [km]:

36.68

Distance to urban areas [km]:

3.96


Radius: 1 km

Number of landcover classes:

2

Dominant landcover type:

30: mosaic cropland (>50%), natural veg. (< 50%)

Fraction of dominant landcover type [%]:

81.0


Radius: 2 km

Number of landcover classes:

2

Dominant landcover type:

30: mosaic cropland (>50%), natural veg. (< 50%)

Fraction of dominant landcover type [%]:

78.0


Radius: 5 km

Number of landcover classes:

3

Dominant landcover type:

30: mosaic cropland (>50%), natural veg. (< 50%)

Fraction of dominant landcover type [%]:

78.0


Radius: 10 km

Number of landcover classes:

3

Dominant landcover type:

30: mosaic cropland (>50%), natural veg. (< 50%)

Fraction of dominant landcover type [%]:

83.0


Radius: 20 km

Number of landcover classes:

2

Dominant landcover type:

30: mosaic cropland (>50%), natural veg. (< 50%)

Fraction of dominant landcover type [%]:

89.0


Disturbances


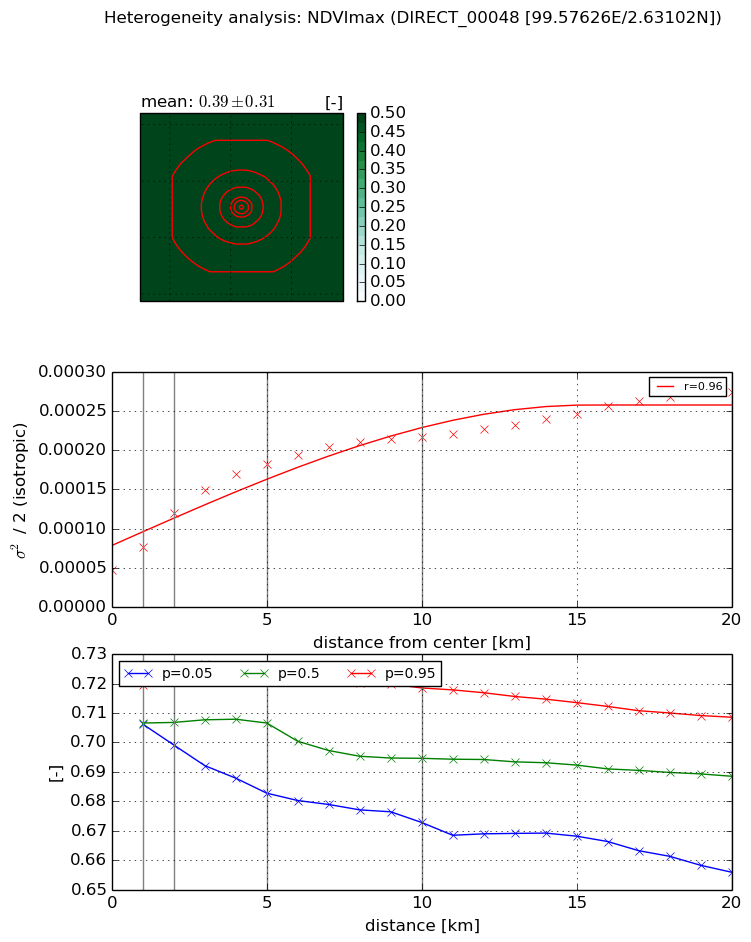
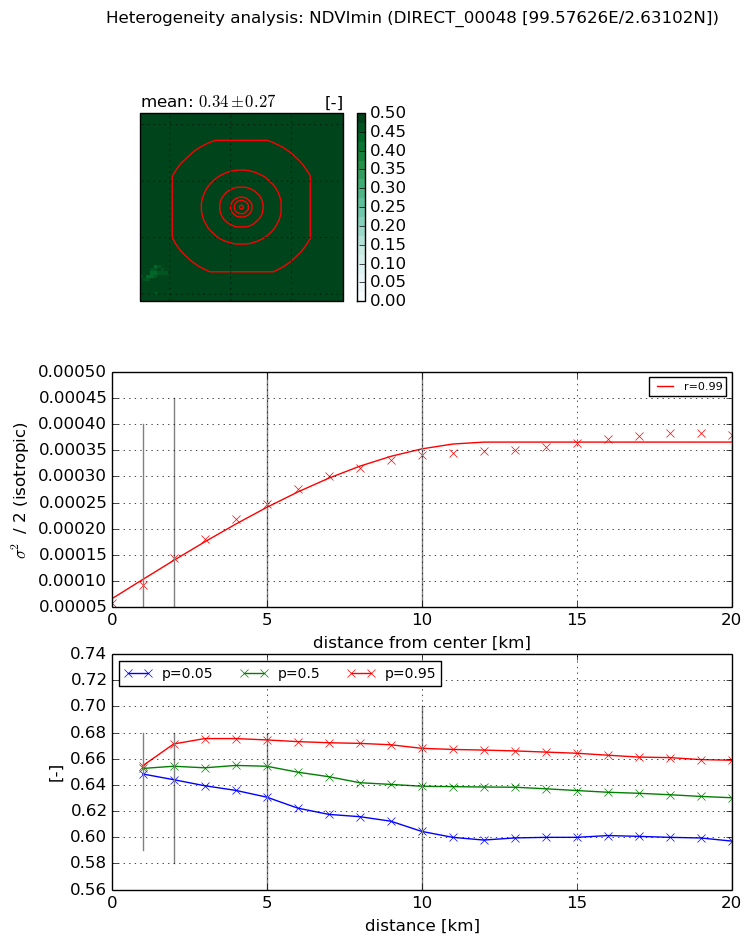
Heterogeneity analysis

The heterogeneity analysis provides information about the spatial and temporal heterogeneity of the site.

Topography


Roman et al. (2009) index


St

2.07212192218

Rcv

0.430221525213

Rse

0.0

Rst

-0.0109907870934

Rsv

1.00657894355


Height range @ 1km [m]

10

Height range @ 2km [m]

14

Height range @ 5km [m]

26

Height range @ 10km [m]

-999

Height range @ 20km [m]

-999


Variance slope @ 1 km

26

Variance slope @ 2 km

21

Variance slope @ 5 km

19

Variance slope @ 10 km

-999

Variance slope @ 20 km

-999


NDVI (max. NDVI composite)


Roman et al. (2009) index


St

3.81204396996

Rcv

0.228724784549

Rse

0.0

Rst

-0.140392652324

Rsv

0.417861943124


NDVI range @ 1km [-]

0.01

NDVI range @ 2km [-]

0.03

NDVI range @ 5km [-]

0.04

NDVI range @ 10km [-]

0.05

NDVI range @ 20km [-]

0.05


Variance slope @ 1 km

2.9654361054e-05

Variance slope @ 2 km

3.64595696815e-05

Variance slope @ 5 km

2.81833178809e-05

Variance slope @ 10 km

1.64203619192e-05

Variance slope @ 20 km

9.34642527671e-06


NDVI (min. NDVI composite)I


Roman et al. (2009) index


St

3.7753303009e-07

Rcv

0.178380610175

Rse

0.0

Rst

0.298600232633

Rsv

7946324.11158


NDVI range @ 1km [-]

0.01

NDVI range @ 2km [-]

0.03

NDVI range @ 5km [-]

0.04

NDVI range @ 10km [-]

0.06

NDVI range @ 20km [-]

0.06


NDVI slope @ 1 km

3.39481660231e-05

NDVI slope @ 2 km

4.24956597979e-05

NDVI slope @ 5 km

3.87403041383e-05

NDVI slope @ 10 km

2.88414702818e-05

NDVI slope @ 20 km

1.4462492281e-05


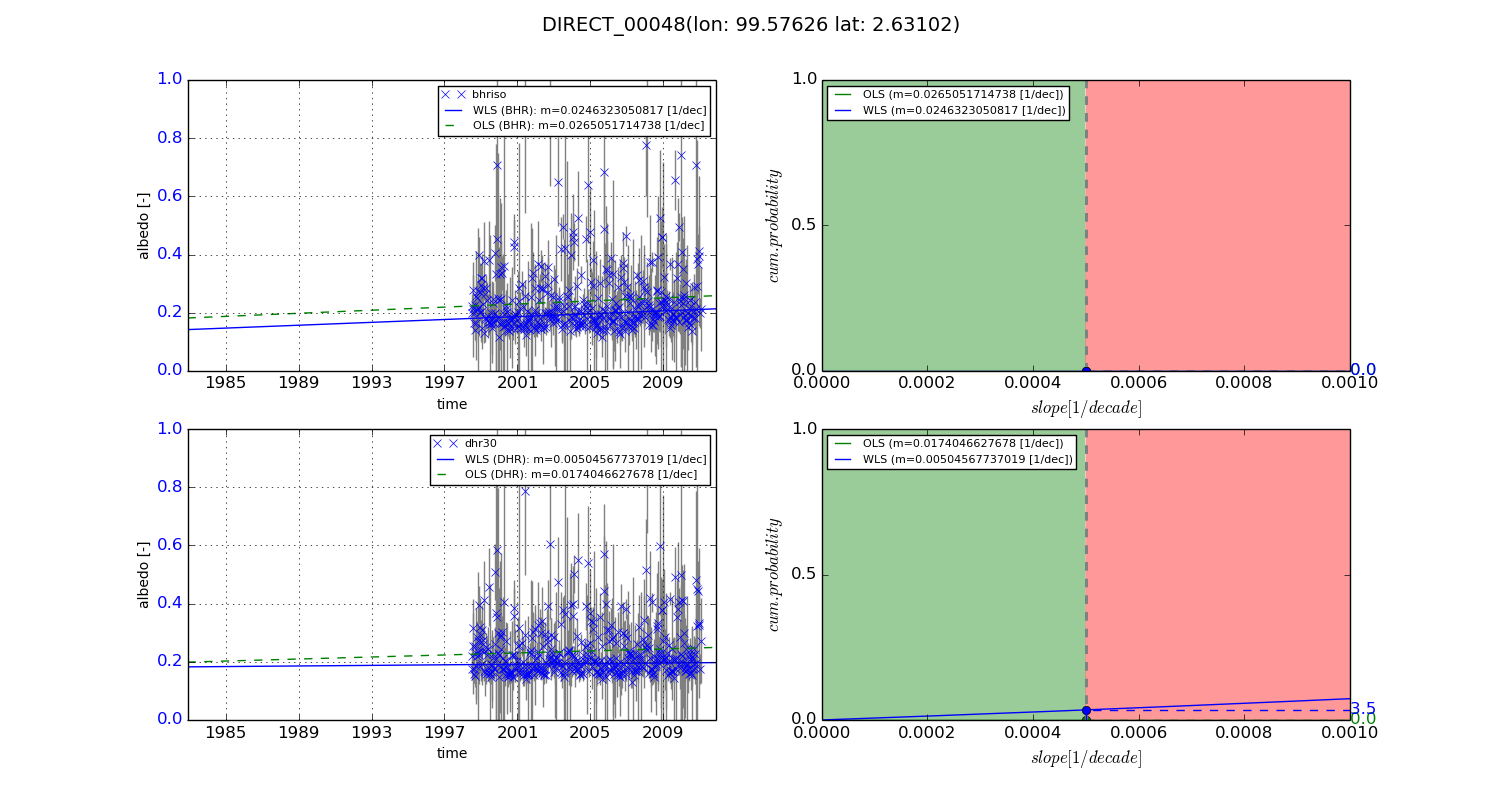
Temporal stability analysis

+000 deg (BHR)


BHR statistics

Temporal stability [1/decade]:


abs

rel


Weighted least square:

None


Ordinary least square:

None


Probabilities that GCOS criteria is met:

Weighted least square:

None %

Ordinary least square:

None %


DHR statistics

Temporal stability [1/decade]:


abs

rel


Weighted least square:

None


Ordinary least square:

None


Probabilities that GCOS criteria is met:

Weighted least square:

None %

Ordinary least square:

None %


+057/+063 deg (BHR)


BHR statistics

Temporal stability [1/decade]:


abs

rel


Weighted least square:

0.0246323050817


Ordinary least square:

0.0265051714738


Probabilities that GCOS criteria is met:

Weighted least square:

0.0 %

Ordinary least square:

0.0 %


DHR statistics

Temporal stability [1/decade]:


abs

rel


Weighted least square:

0.00504567737019


Ordinary least square:

0.0174046627678


Probabilities that GCOS criteria is met:

Weighted least square:

3.5 %

Ordinary least square:

0.0 %


Temporal anomaly analyis

The variance of the temporal anomalies provides an additional measure about the stability of the signal AFTER removal of the mean seasonal cylce.

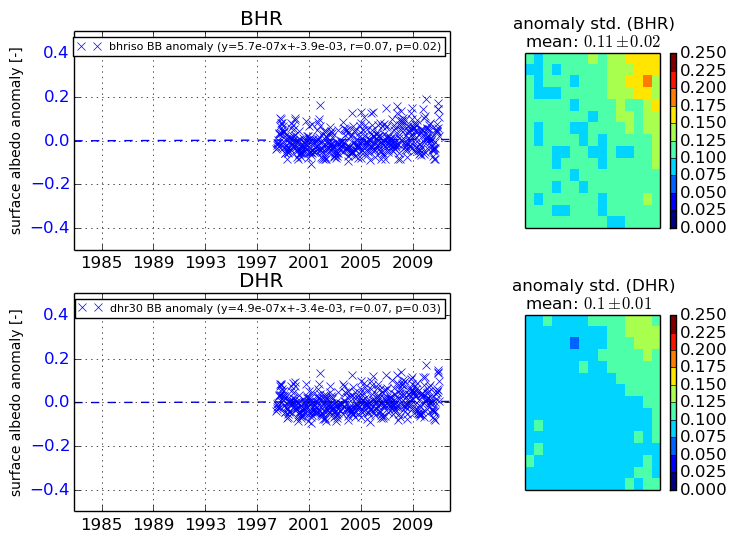
+000 deg


+057/+063 deg