DIRECT_00049


Location

lon / lat [deg]: 4.7425 / 43.8072

Source network: DIRECT


Geostationary surface albedo (GSA) data


“+000”


“+057/+063”


Landcover information (based on ESA CCI landcover data)


Landcover fractions @ 2km distance


Landcover fractions @ 20 km distance


Legend


Distance to open water bodies [km]:

4.97

Distance to urban areas [km]:

1.98


Radius: 1 km

Number of landcover classes:

3

Dominant landcover type:

10: cropland, rainfed

Fraction of dominant landcover type [%]:

54.0


Radius: 2 km

Number of landcover classes:

4

Dominant landcover type:

10: cropland, rainfed

Fraction of dominant landcover type [%]:

75.0


Radius: 5 km

Number of landcover classes:

6

Dominant landcover type:

10: cropland, rainfed

Fraction of dominant landcover type [%]:

69.0


Radius: 10 km

Number of landcover classes:

8

Dominant landcover type:

10: cropland, rainfed

Fraction of dominant landcover type [%]:

51.0


Radius: 20 km

Number of landcover classes:

9

Dominant landcover type:

10: cropland, rainfed

Fraction of dominant landcover type [%]:

38.0


Disturbances


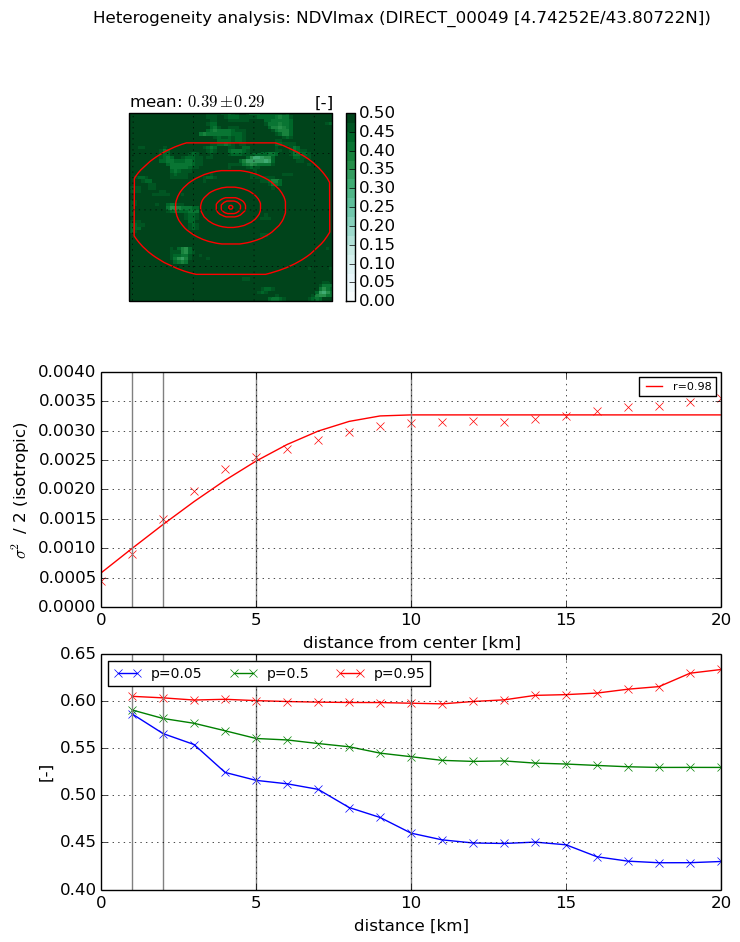
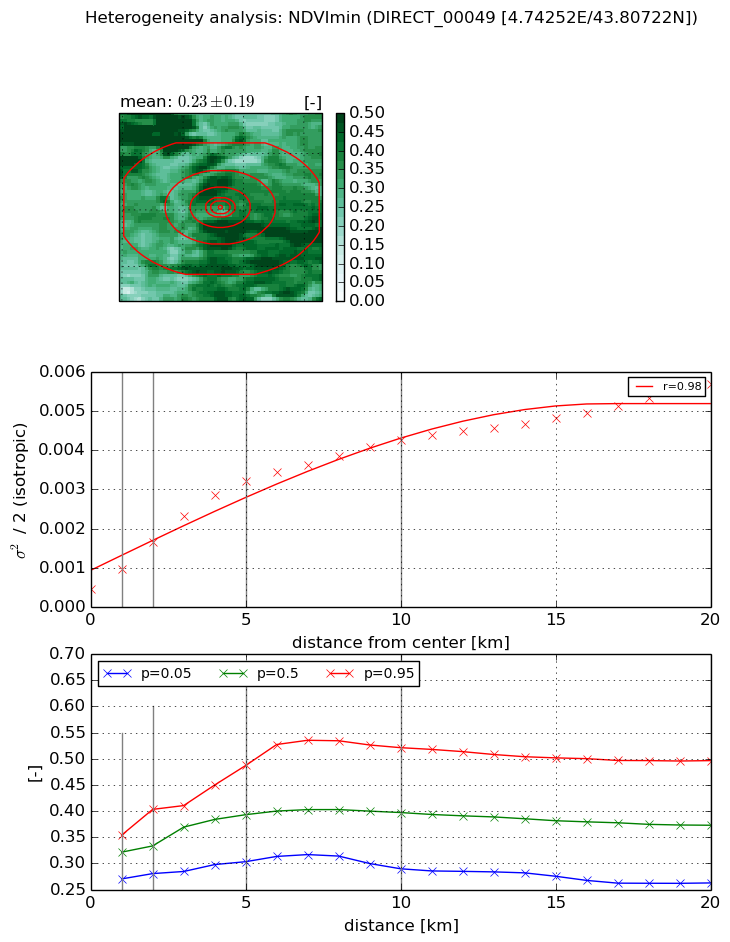
Heterogeneity analysis

The heterogeneity analysis provides information about the spatial and temporal heterogeneity of the site.

Topography


Roman et al. (2009) index


St

1.22831842419e-06

Rcv

1.24963384883

Rse

0.0

Rst

0.0339819228134

Rsv

2442362.14667


Height range @ 1km [m]

4

Height range @ 2km [m]

5

Height range @ 5km [m]

99

Height range @ 10km [m]

-999

Height range @ 20km [m]

-999


Variance slope @ 1 km

313

Variance slope @ 2 km

426

Variance slope @ 5 km

475

Variance slope @ 10 km

-999

Variance slope @ 20 km

-999


NDVI (max. NDVI composite)


Roman et al. (2009) index


St

2.14861720739

Rcv

0.845651099903

Rse

0.0

Rst

-0.0293458018963

Rsv

0.521249944626


NDVI range @ 1km [-]

0.02

NDVI range @ 2km [-]

0.04

NDVI range @ 5km [-]

0.08

NDVI range @ 10km [-]

0.14

NDVI range @ 20km [-]

0.2


Variance slope @ 1 km

0.000453730145334

Variance slope @ 2 km

0.000526944841352

Variance slope @ 5 km

0.00043992561211

Variance slope @ 10 km

0.000260369362369

Variance slope @ 20 km

0.000120322271544


NDVI (min. NDVI composite)I


Roman et al. (2009) index


St

4.53515756124

Rcv

0.179498381003

Rse

0.0

Rst

-0.083142816466

Rsv

0.398857319283


NDVI range @ 1km [-]

0.08

NDVI range @ 2km [-]

0.12

NDVI range @ 5km [-]

0.18

NDVI range @ 10km [-]

0.23

NDVI range @ 20km [-]

0.23


NDVI slope @ 1 km

0.000497304423607

NDVI slope @ 2 km

0.000604584164736

NDVI slope @ 5 km

0.000573959695509

NDVI slope @ 10 km

0.000374711224317

NDVI slope @ 20 km

0.000223548586403


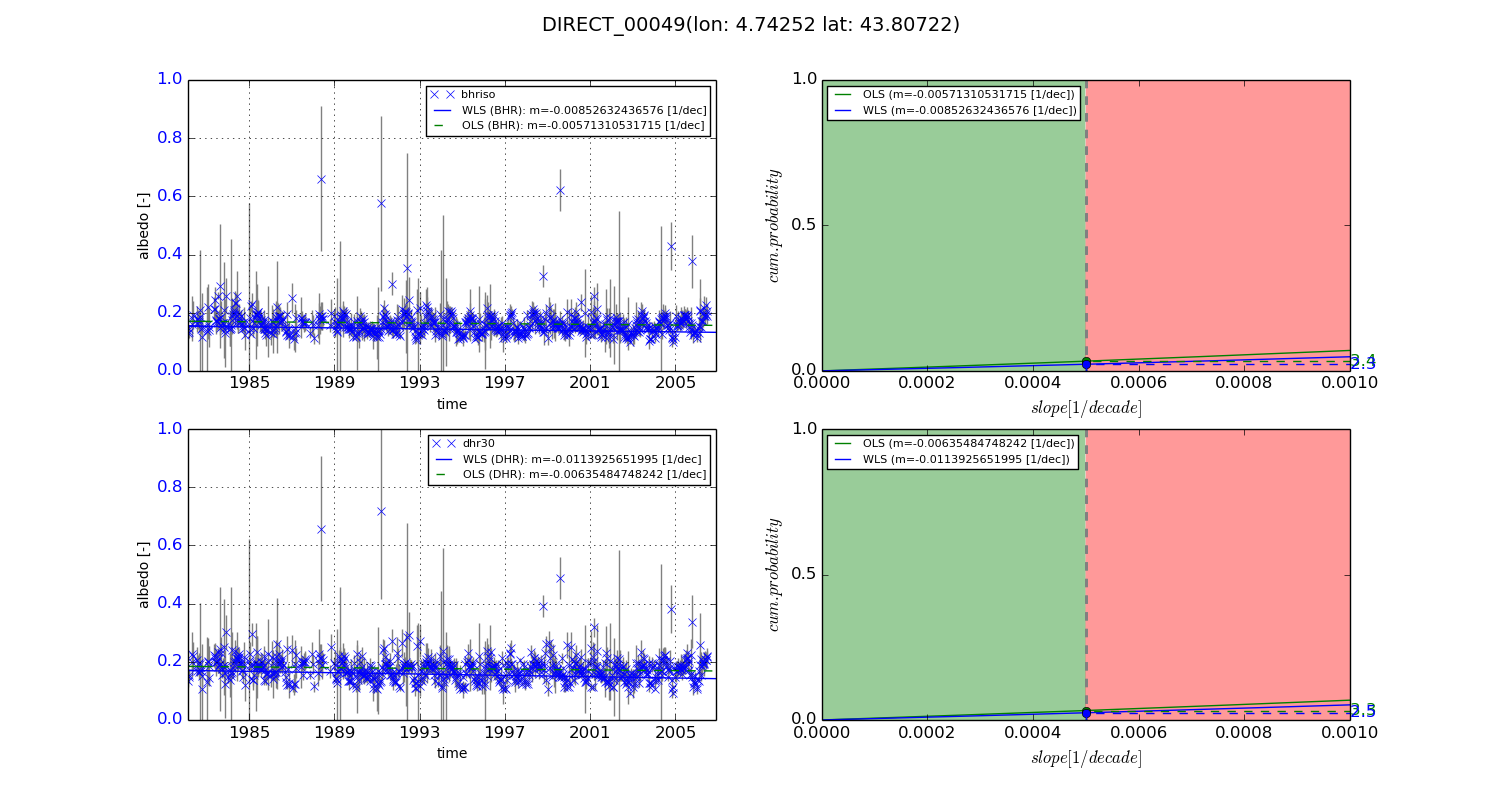
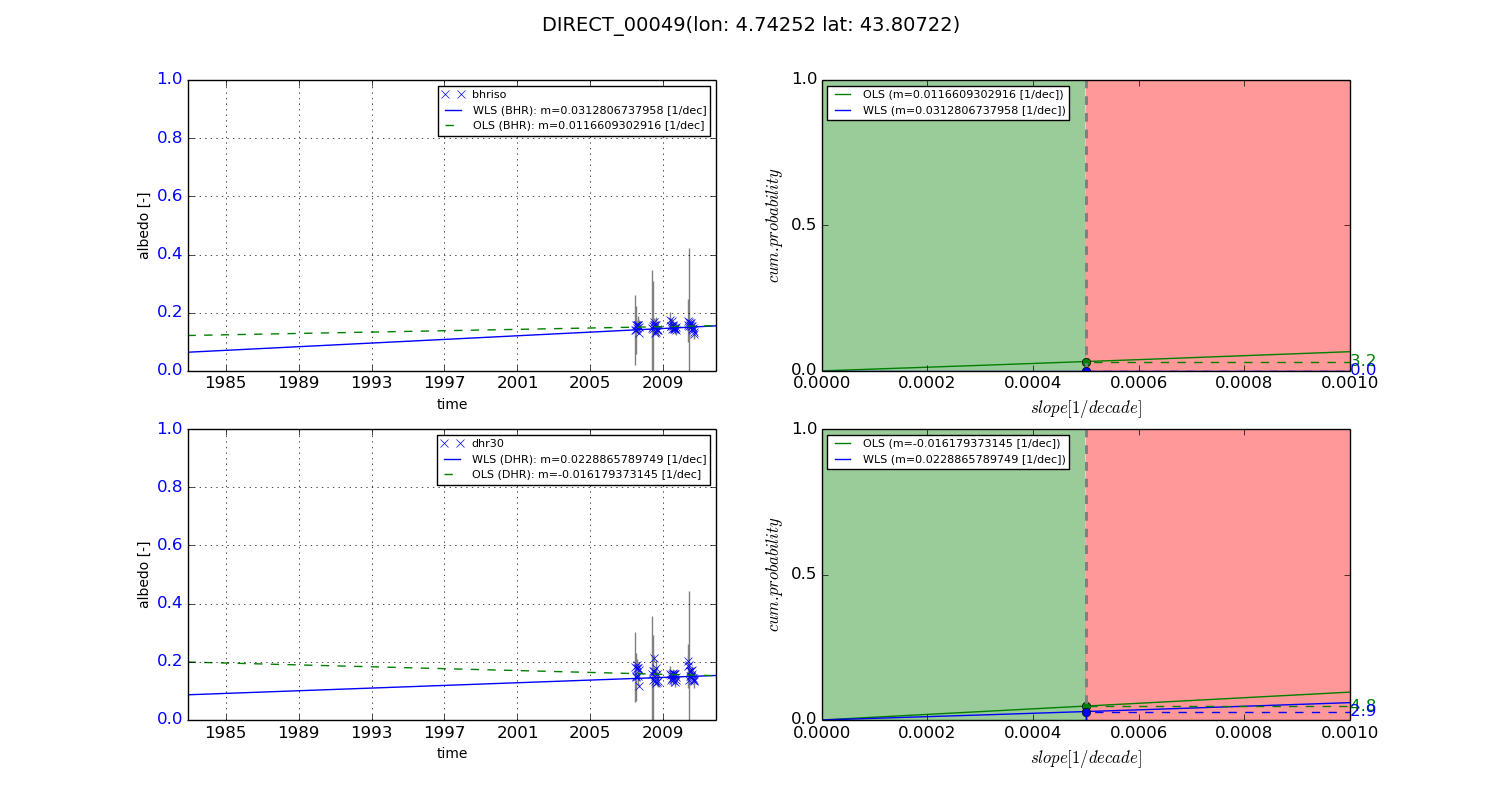
Temporal stability analysis

+000 deg (BHR)


BHR statistics

Temporal stability [1/decade]:


abs

rel


Weighted least square:

-0.00852632436576


Ordinary least square:

-0.00571310531715


Probabilities that GCOS criteria is met:

Weighted least square:

2.3 %

Ordinary least square:

3.4 %


DHR statistics

Temporal stability [1/decade]:


abs

rel


Weighted least square:

-0.0113925651995


Ordinary least square:

-0.00635484748242


Probabilities that GCOS criteria is met:

Weighted least square:

2.5 %

Ordinary least square:

3.3 %


+057/+063 deg (BHR)


BHR statistics

Temporal stability [1/decade]:


abs

rel


Weighted least square:

0.0312806737958


Ordinary least square:

0.0116609302916


Probabilities that GCOS criteria is met:

Weighted least square:

0.0 %

Ordinary least square:

3.2 %


DHR statistics

Temporal stability [1/decade]:


abs

rel


Weighted least square:

0.0228865789749


Ordinary least square:

-0.016179373145


Probabilities that GCOS criteria is met:

Weighted least square:

2.9 %

Ordinary least square:

4.8 %


Temporal anomaly analyis

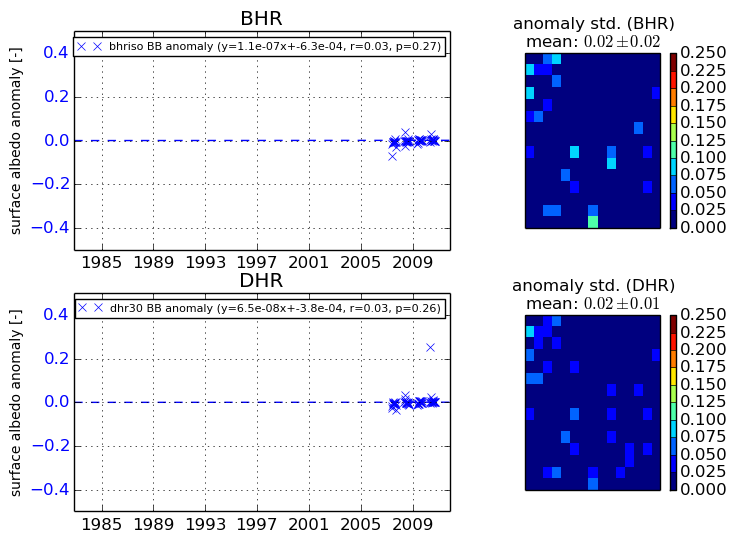
The variance of the temporal anomalies provides an additional measure about the stability of the signal AFTER removal of the mean seasonal cylce.
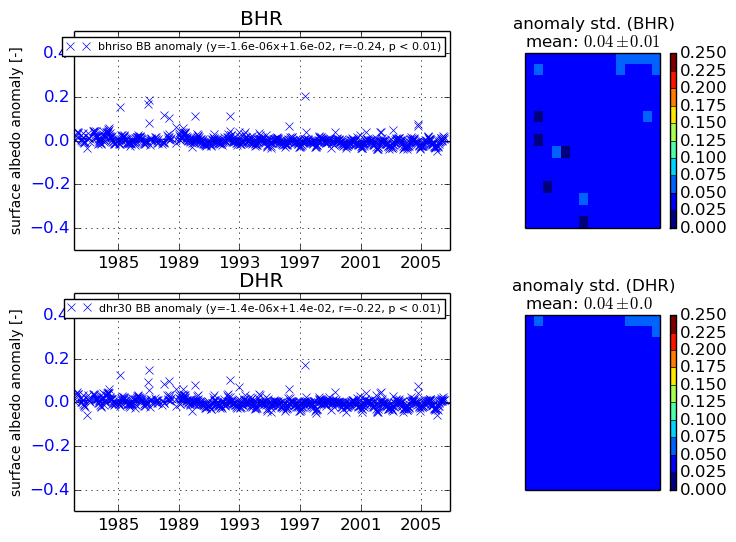
+000 deg


+057/+063 deg