DIRECT_00052


Location

lon / lat [deg]: 116.2542 / -32.5983

Source network: DIRECT


Geostationary surface albedo (GSA) data


“+000”


“+057/+063”


Landcover information (based on ESA CCI landcover data)


Landcover fractions @ 2km distance


Landcover fractions @ 20 km distance


Legend


Distance to open water bodies [km]:

13.68

Distance to urban areas [km]:

27.4


Radius: 1 km

Number of landcover classes:

3

Dominant landcover type:

50: Tree cover, broadleaved, evergreen, closed to open (>15%)

Fraction of dominant landcover type [%]:

46.0


Radius: 2 km

Number of landcover classes:

3

Dominant landcover type:

50: Tree cover, broadleaved, evergreen, closed to open (>15%)

Fraction of dominant landcover type [%]:

67.0


Radius: 5 km

Number of landcover classes:

3

Dominant landcover type:

50: Tree cover, broadleaved, evergreen, closed to open (>15%)

Fraction of dominant landcover type [%]:

89.0


Radius: 10 km

Number of landcover classes:

3

Dominant landcover type:

50: Tree cover, broadleaved, evergreen, closed to open (>15%)

Fraction of dominant landcover type [%]:

89.0


Radius: 20 km

Number of landcover classes:

4

Dominant landcover type:

50: Tree cover, broadleaved, evergreen, closed to open (>15%)

Fraction of dominant landcover type [%]:

81.0


Disturbances


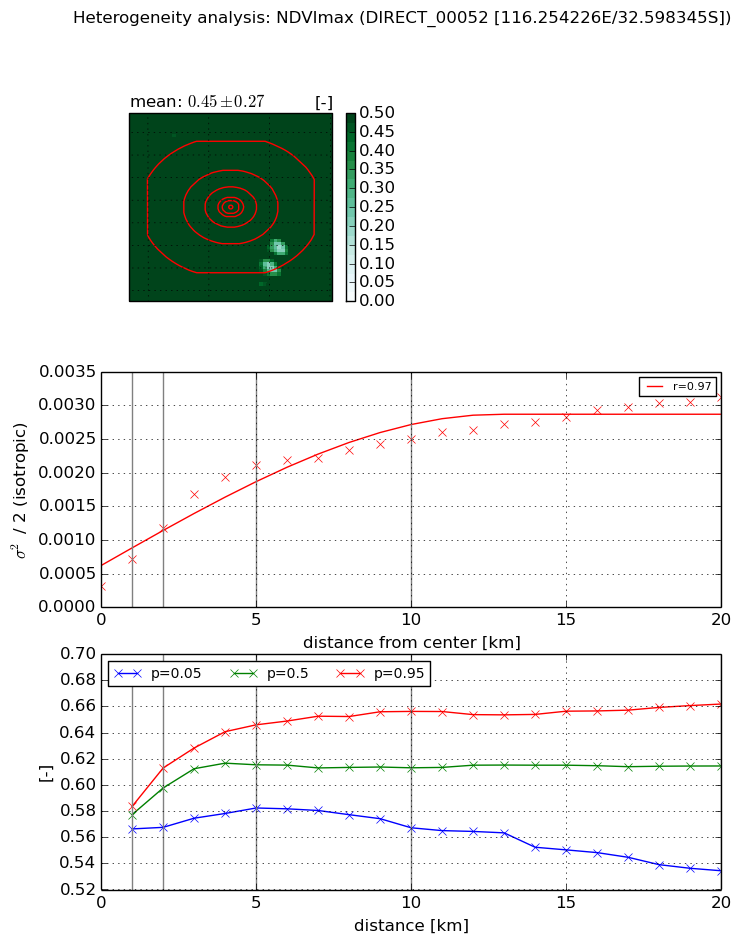
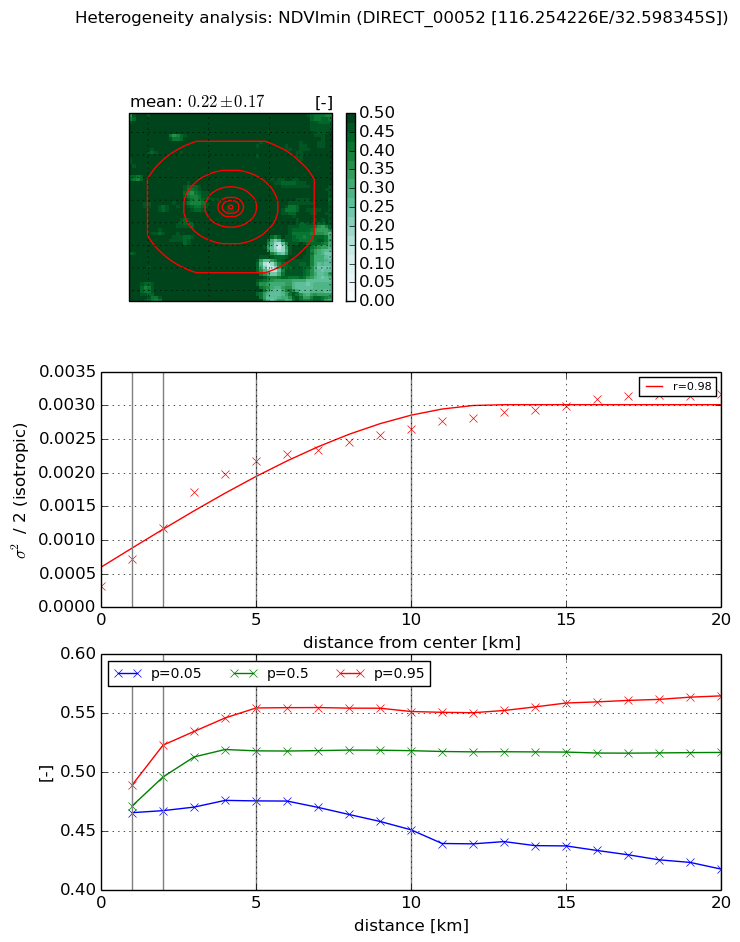
Heterogeneity analysis

The heterogeneity analysis provides information about the spatial and temporal heterogeneity of the site.

Topography


Roman et al. (2009) index


St

8.19554312231

Rcv

0.0563825984974

Rse

0.0

Rst

-0.0517232530134

Rsv

-0.257946764555


Height range @ 1km [m]

61

Height range @ 2km [m]

76

Height range @ 5km [m]

89

Height range @ 10km [m]

-999

Height range @ 20km [m]

-999


Variance slope @ 1 km

392

Variance slope @ 2 km

280

Variance slope @ 5 km

123

Variance slope @ 10 km

-999

Variance slope @ 20 km

-999


NDVI (max. NDVI composite)


Roman et al. (2009) index


St

nan

Rcv

nan

Rse

nan

Rst

nan

Rsv

nan


NDVI range @ 1km [-]

0.02

NDVI range @ 2km [-]

0.05

NDVI range @ 5km [-]

0.06

NDVI range @ 10km [-]

0.09

NDVI range @ 20km [-]

0.13


Variance slope @ 1 km

0.000407435543917

Variance slope @ 2 km

0.000435198025537

Variance slope @ 5 km

0.000375963889288

Variance slope @ 10 km

0.000205389816155

Variance slope @ 20 km

0.000113090986233


NDVI (min. NDVI composite)I


Roman et al. (2009) index


St

1.96027520989

Rcv

0.0593313467572

Rse

0.0

Rst

-0.471067079892

Rsv

-0.999998930244


NDVI range @ 1km [-]

0.02

NDVI range @ 2km [-]

0.06

NDVI range @ 5km [-]

0.08

NDVI range @ 10km [-]

0.1

NDVI range @ 20km [-]

0.15


NDVI slope @ 1 km

0.00040306034087

NDVI slope @ 2 km

0.000433973427074

NDVI slope @ 5 km

0.000389186873267

NDVI slope @ 10 km

0.000221489969202

NDVI slope @ 20 km

0.000119679599848


Temporal stability analysis

+000 deg (BHR)


BHR statistics

Temporal stability [1/decade]:


abs

rel


Weighted least square:

None


Ordinary least square:

None


Probabilities that GCOS criteria is met:

Weighted least square:

None %

Ordinary least square:

None %


DHR statistics

Temporal stability [1/decade]:


abs

rel


Weighted least square:

None


Ordinary least square:

None


Probabilities that GCOS criteria is met:

Weighted least square:

None %

Ordinary least square:

None %


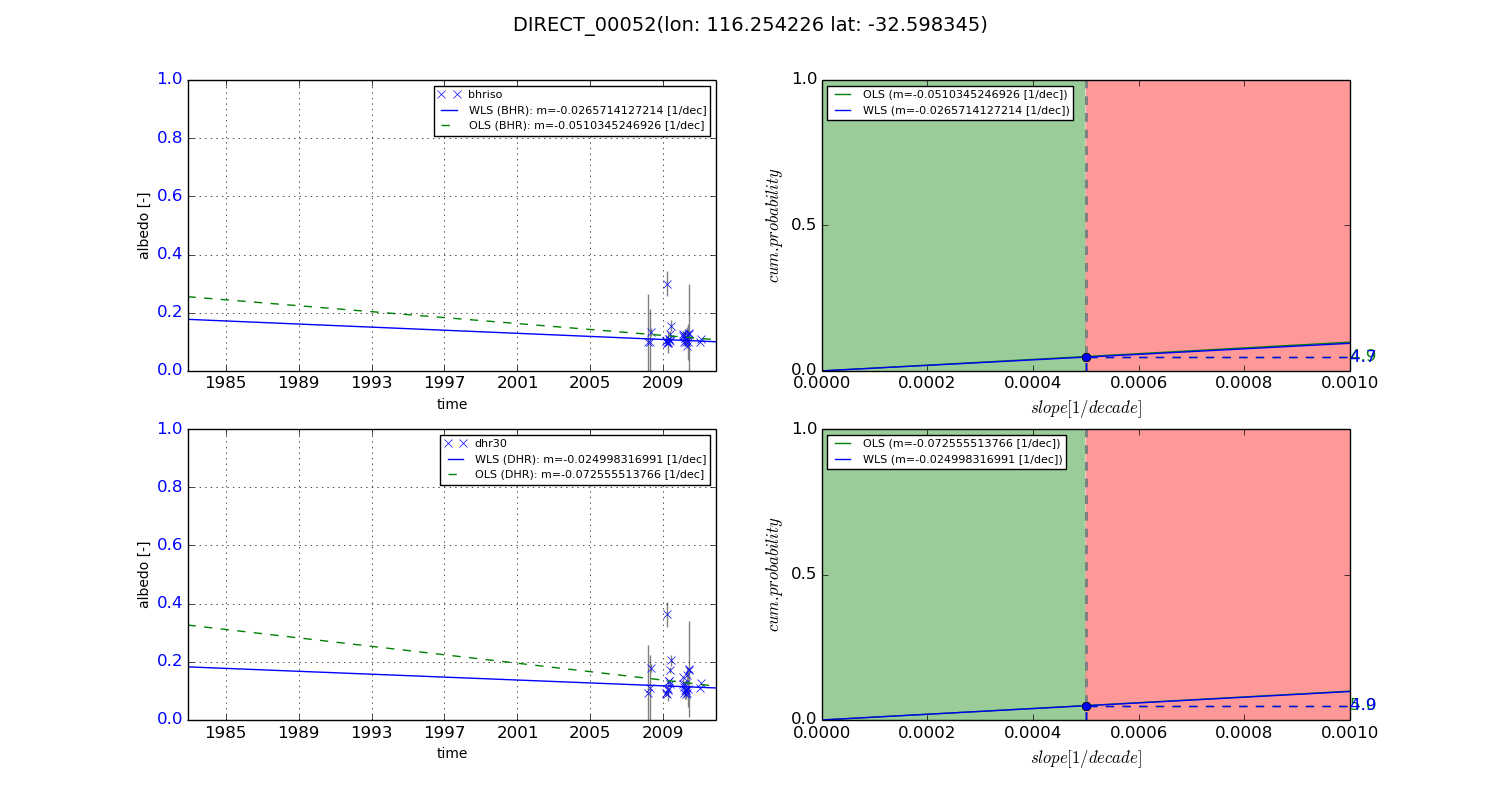
+057/+063 deg (BHR)


BHR statistics

Temporal stability [1/decade]:


abs

rel


Weighted least square:

-0.0265714127214


Ordinary least square:

-0.0510345246926


Probabilities that GCOS criteria is met:

Weighted least square:

4.7 %

Ordinary least square:

4.9 %


DHR statistics

Temporal stability [1/decade]:


abs

rel


Weighted least square:

-0.024998316991


Ordinary least square:

-0.072555513766


Probabilities that GCOS criteria is met:

Weighted least square:

4.9 %

Ordinary least square:

5.0 %


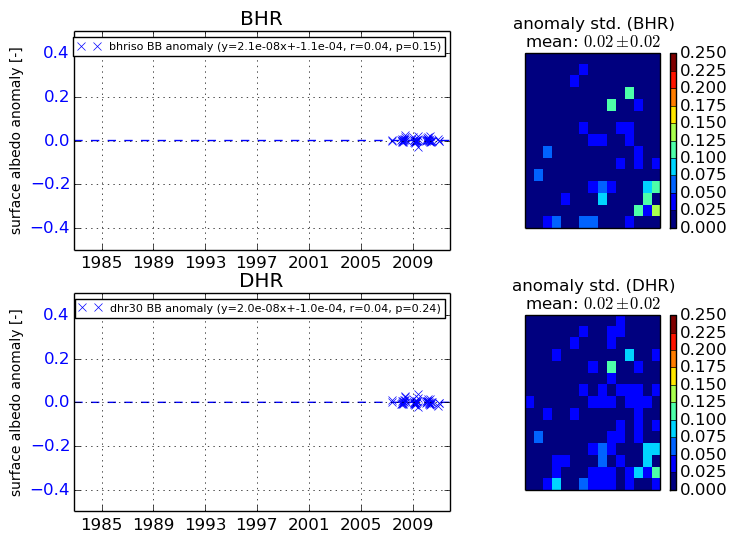
Temporal anomaly analyis

The variance of the temporal anomalies provides an additional measure about the stability of the signal AFTER removal of the mean seasonal cylce.

+000 deg


+057/+063 deg


By continuing to use this website, you are giving consent to analytic cookies being used. For more information on how EUMETSAT uses data and how you can disable this, please view this web page: Analytics Cookie Policy