DIRECT_00057


Location

lon / lat [deg]: 26.5832 / 44.406

Source network: DIRECT


Geostationary surface albedo (GSA) data


“+000”


“+057/+063”


Landcover information (based on ESA CCI landcover data)


Landcover fractions @ 2km distance


Landcover fractions @ 20 km distance


Legend


Distance to open water bodies [km]:

2.96

Distance to urban areas [km]:

2.38


Radius: 1 km

Number of landcover classes:

1

Dominant landcover type:

10: cropland, rainfed

Fraction of dominant landcover type [%]:

100.0


Radius: 2 km

Number of landcover classes:

1

Dominant landcover type:

10: cropland, rainfed

Fraction of dominant landcover type [%]:

100.0


Radius: 5 km

Number of landcover classes:

4

Dominant landcover type:

10: cropland, rainfed

Fraction of dominant landcover type [%]:

91.0


Radius: 10 km

Number of landcover classes:

4

Dominant landcover type:

10: cropland, rainfed

Fraction of dominant landcover type [%]:

88.0


Radius: 20 km

Number of landcover classes:

4

Dominant landcover type:

10: cropland, rainfed

Fraction of dominant landcover type [%]:

88.0


Disturbances


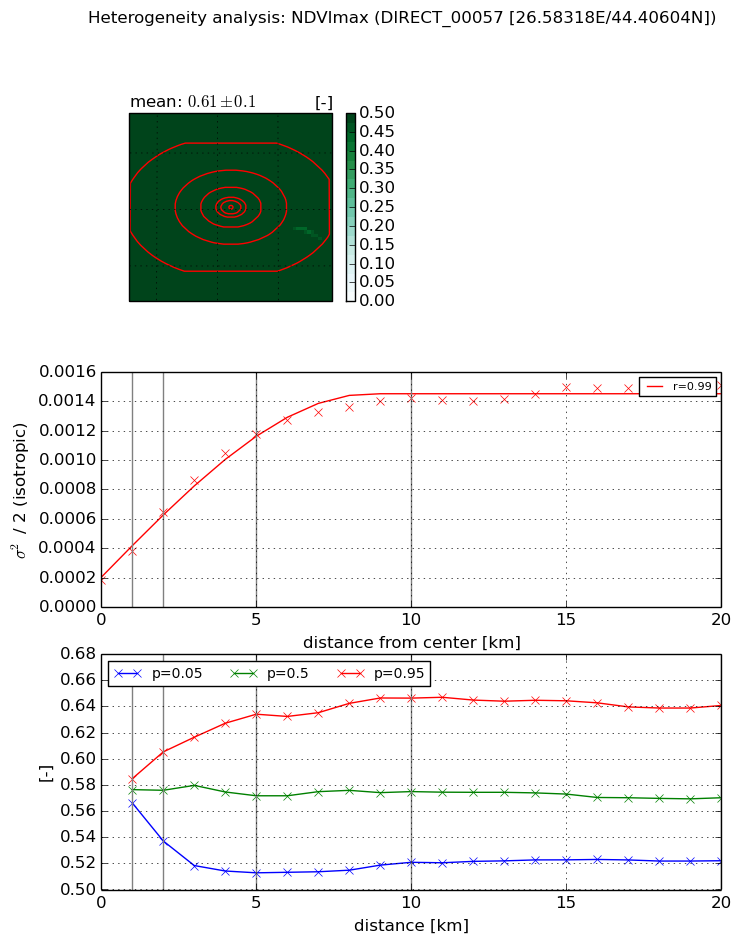
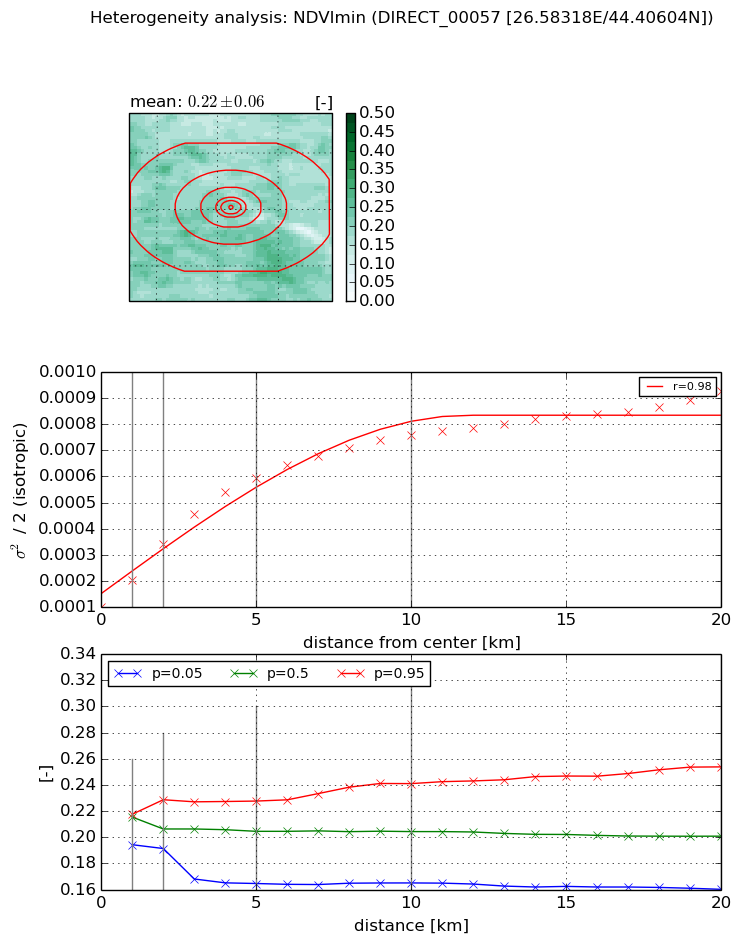
Heterogeneity analysis

The heterogeneity analysis provides information about the spatial and temporal heterogeneity of the site.

Topography


Roman et al. (2009) index


St

4.96823273985e-06

Rcv

0.597544611654

Rse

0.0

Rst

-0.270596629266

Rsv

603835.577751


Height range @ 1km [m]

3

Height range @ 2km [m]

6

Height range @ 5km [m]

24

Height range @ 10km [m]

-999

Height range @ 20km [m]

-999


Variance slope @ 1 km

28

Variance slope @ 2 km

17

Variance slope @ 5 km

8

Variance slope @ 10 km

-999

Variance slope @ 20 km

-999


NDVI (max. NDVI composite)


Roman et al. (2009) index


St

3.35024803648e-06

Rcv

0.186575044816

Rse

0.0

Rst

0.096451665293

Rsv

895455.804801


NDVI range @ 1km [-]

0.02

NDVI range @ 2km [-]

0.07

NDVI range @ 5km [-]

0.12

NDVI range @ 10km [-]

0.13

NDVI range @ 20km [-]

0.12


Variance slope @ 1 km

0.000195336690305

Variance slope @ 2 km

0.000229004451065

Variance slope @ 5 km

0.000204688675228

Variance slope @ 10 km

0.000123135262522

Variance slope @ 20 km

5.18465023016e-05


NDVI (min. NDVI composite)I


Roman et al. (2009) index


St

10.869417468

Rcv

0.245947212649

Rse

0.0

Rst

-2.02177488569e-08

Rsv

-0.0300565188366


NDVI range @ 1km [-]

0.02

NDVI range @ 2km [-]

0.04

NDVI range @ 5km [-]

0.06

NDVI range @ 10km [-]

0.08

NDVI range @ 20km [-]

0.09


NDVI slope @ 1 km

0.000103211236463

NDVI slope @ 2 km

0.000121107674003

NDVI slope @ 5 km

0.000102489816767

NDVI slope @ 10 km

6.43755773018e-05

NDVI slope @ 20 km

3.32490323773e-05


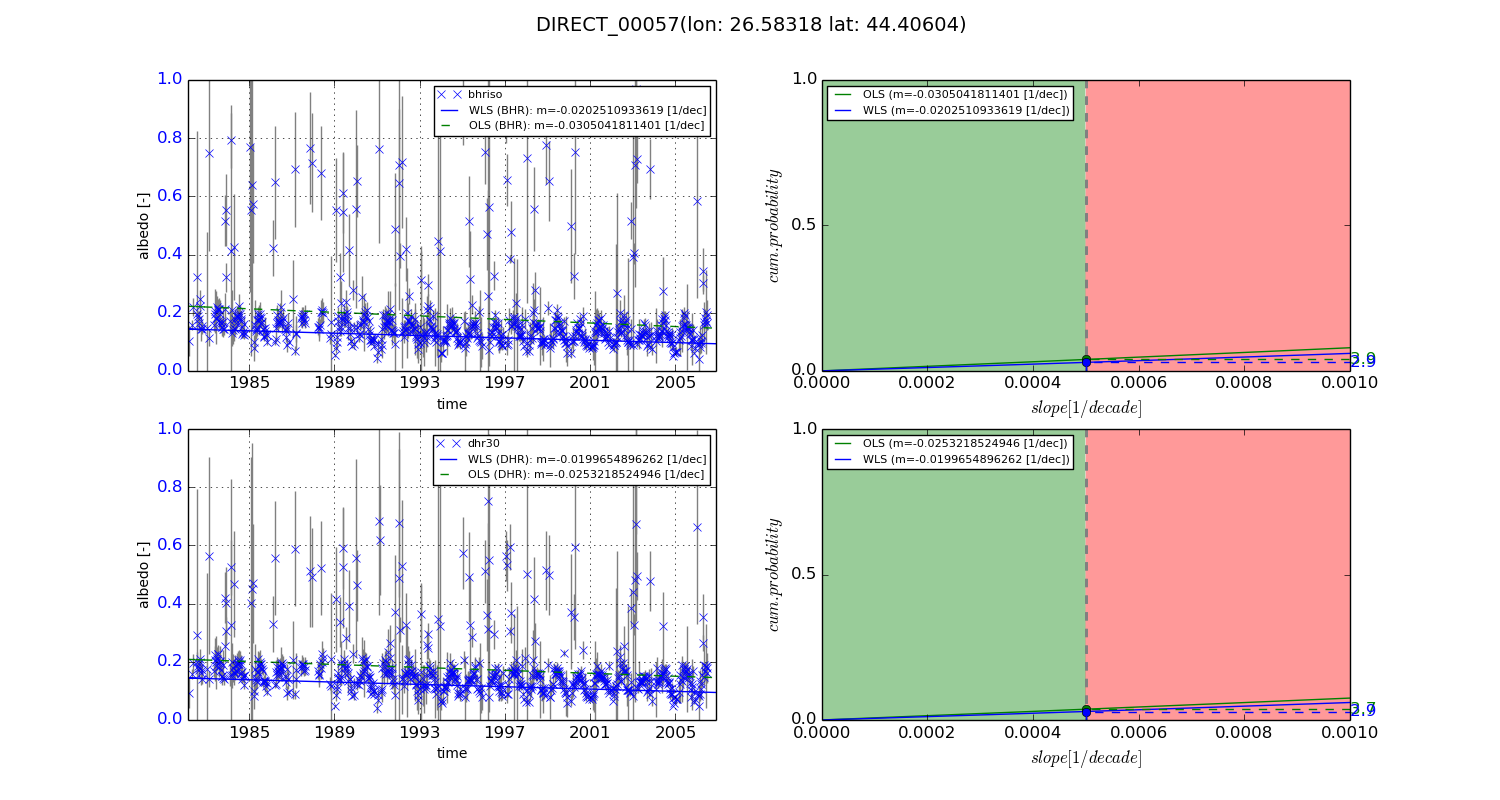
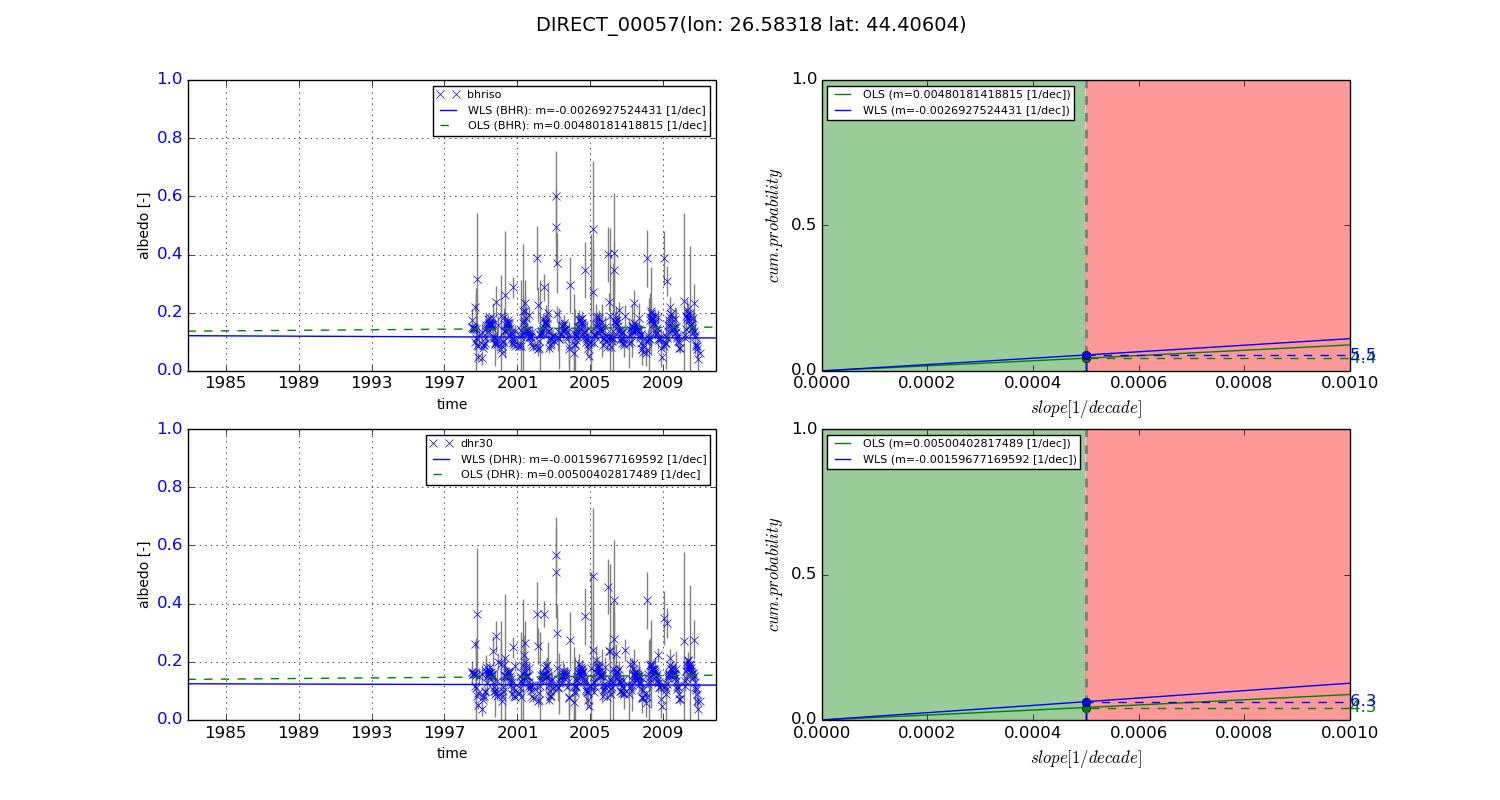
Temporal stability analysis

+000 deg (BHR)


BHR statistics

Temporal stability [1/decade]:


abs

rel


Weighted least square:

-0.0202510933619


Ordinary least square:

-0.0305041811401


Probabilities that GCOS criteria is met:

Weighted least square:

2.9 %

Ordinary least square:

3.9 %


DHR statistics

Temporal stability [1/decade]:


abs

rel


Weighted least square:

-0.0199654896262


Ordinary least square:

-0.0253218524946


Probabilities that GCOS criteria is met:

Weighted least square:

2.9 %

Ordinary least square:

3.7 %


+057/+063 deg (BHR)


BHR statistics

Temporal stability [1/decade]:


abs

rel


Weighted least square:

-0.0026927524431


Ordinary least square:

0.00480181418815


Probabilities that GCOS criteria is met:

Weighted least square:

5.5 %

Ordinary least square:

4.4 %


DHR statistics

Temporal stability [1/decade]:


abs

rel


Weighted least square:

-0.00159677169592


Ordinary least square:

0.00500402817489


Probabilities that GCOS criteria is met:

Weighted least square:

6.3 %

Ordinary least square:

4.3 %


Temporal anomaly analyis

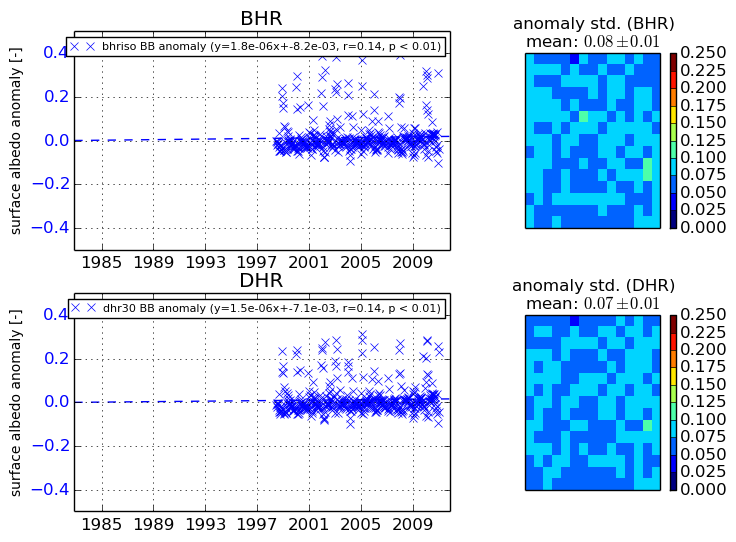
The variance of the temporal anomalies provides an additional measure about the stability of the signal AFTER removal of the mean seasonal cylce.
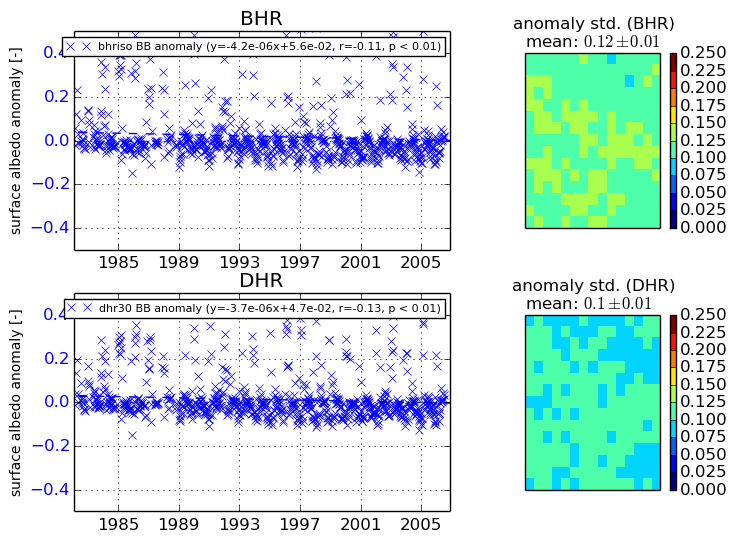
+000 deg


+057/+063 deg