DIRECT_00060


Location

lon / lat [deg]: -1.5546 / 15.3247

Source network: DIRECT


Geostationary surface albedo (GSA) data


“+000”


“+057/+063”


Landcover information (based on ESA CCI landcover data)


Landcover fractions @ 2km distance


Landcover fractions @ 20 km distance


Legend


Distance to open water bodies [km]:

10.49

Distance to urban areas [km]:

none in region


Radius: 1 km

Number of landcover classes:

2

Dominant landcover type:

130: grassland

Fraction of dominant landcover type [%]:

97.0


Radius: 2 km

Number of landcover classes:

2

Dominant landcover type:

130: grassland

Fraction of dominant landcover type [%]:

92.0


Radius: 5 km

Number of landcover classes:

3

Dominant landcover type:

130: grassland

Fraction of dominant landcover type [%]:

88.0


Radius: 10 km

Number of landcover classes:

3

Dominant landcover type:

130: grassland

Fraction of dominant landcover type [%]:

84.0


Radius: 20 km

Number of landcover classes:

4

Dominant landcover type:

130: grassland

Fraction of dominant landcover type [%]:

71.0


Disturbances


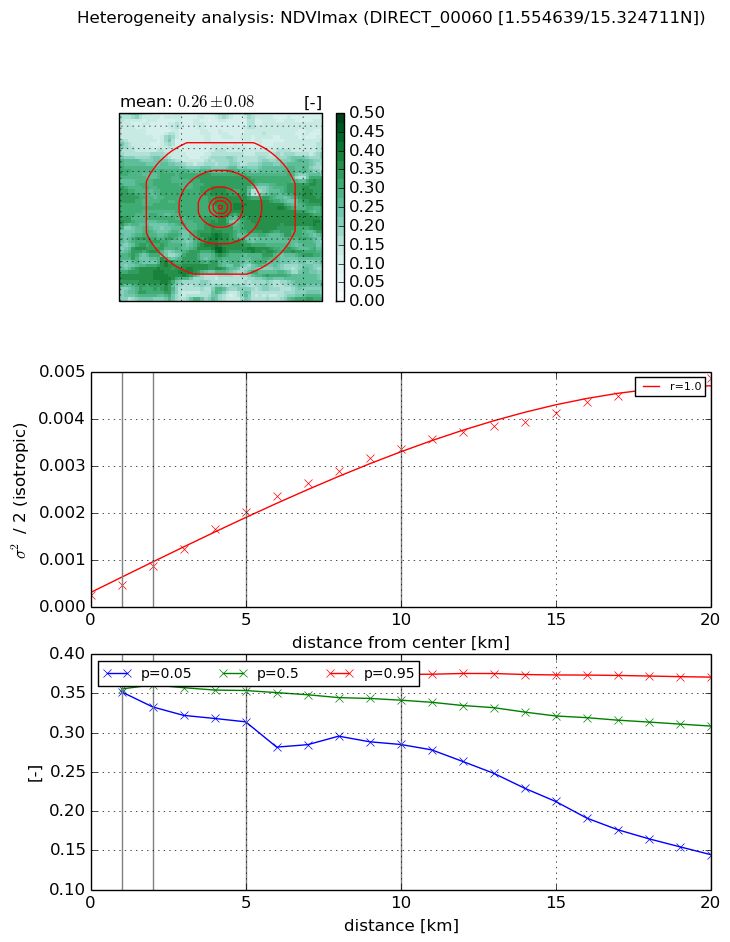
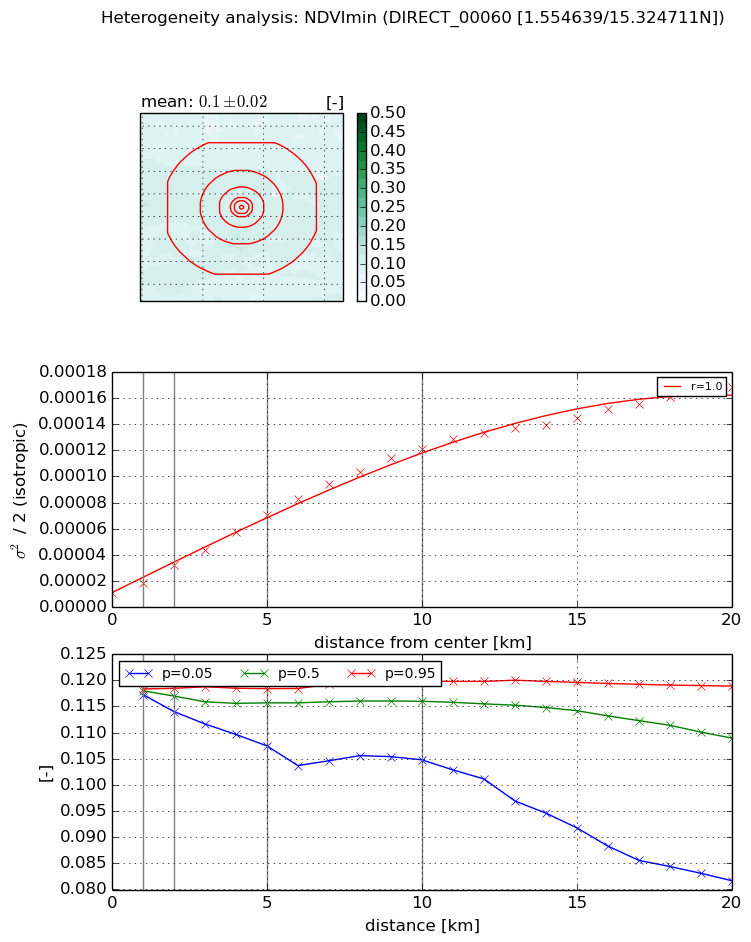
Heterogeneity analysis

The heterogeneity analysis provides information about the spatial and temporal heterogeneity of the site.

Topography


Roman et al. (2009) index


St

1.29638901727

Rcv

0.499849533392

Rse

0.0

Rst

1.54380189107e-05

Rsv

1.81425521939


Height range @ 1km [m]

16

Height range @ 2km [m]

27

Height range @ 5km [m]

54

Height range @ 10km [m]

-999

Height range @ 20km [m]

-999


Variance slope @ 1 km

41

Variance slope @ 2 km

44

Variance slope @ 5 km

57

Variance slope @ 10 km

-999

Variance slope @ 20 km

-999


NDVI (max. NDVI composite)


Roman et al. (2009) index


St

2.53662533872e-07

Rcv

0.531004134936

Rse

0.0

Rst

0.205309114982

Rsv

11826735.9686


NDVI range @ 1km [-]

0.02

NDVI range @ 2km [-]

0.04

NDVI range @ 5km [-]

0.06

NDVI range @ 10km [-]

0.09

NDVI range @ 20km [-]

0.23


Variance slope @ 1 km

0.000227415291139

Variance slope @ 2 km

0.000316893655878

Variance slope @ 5 km

0.000364437856282

Variance slope @ 10 km

0.000326593578037

Variance slope @ 20 km

0.000228638615744


NDVI (min. NDVI composite)I


Roman et al. (2009) index


St

2.96183479199e-07

Rcv

0.542119274074

Rse

0.0

Rst

0.118491842359

Rsv

10128855.9796


NDVI range @ 1km [-]

0.0

NDVI range @ 2km [-]

0.0

NDVI range @ 5km [-]

0.01

NDVI range @ 10km [-]

0.02

NDVI range @ 20km [-]

0.04


NDVI slope @ 1 km

8.14147987954e-06

NDVI slope @ 2 km

1.08439919781e-05

NDVI slope @ 5 km

1.21362492793e-05

NDVI slope @ 10 km

1.16137731857e-05

NDVI slope @ 20 km

7.90860310021e-06


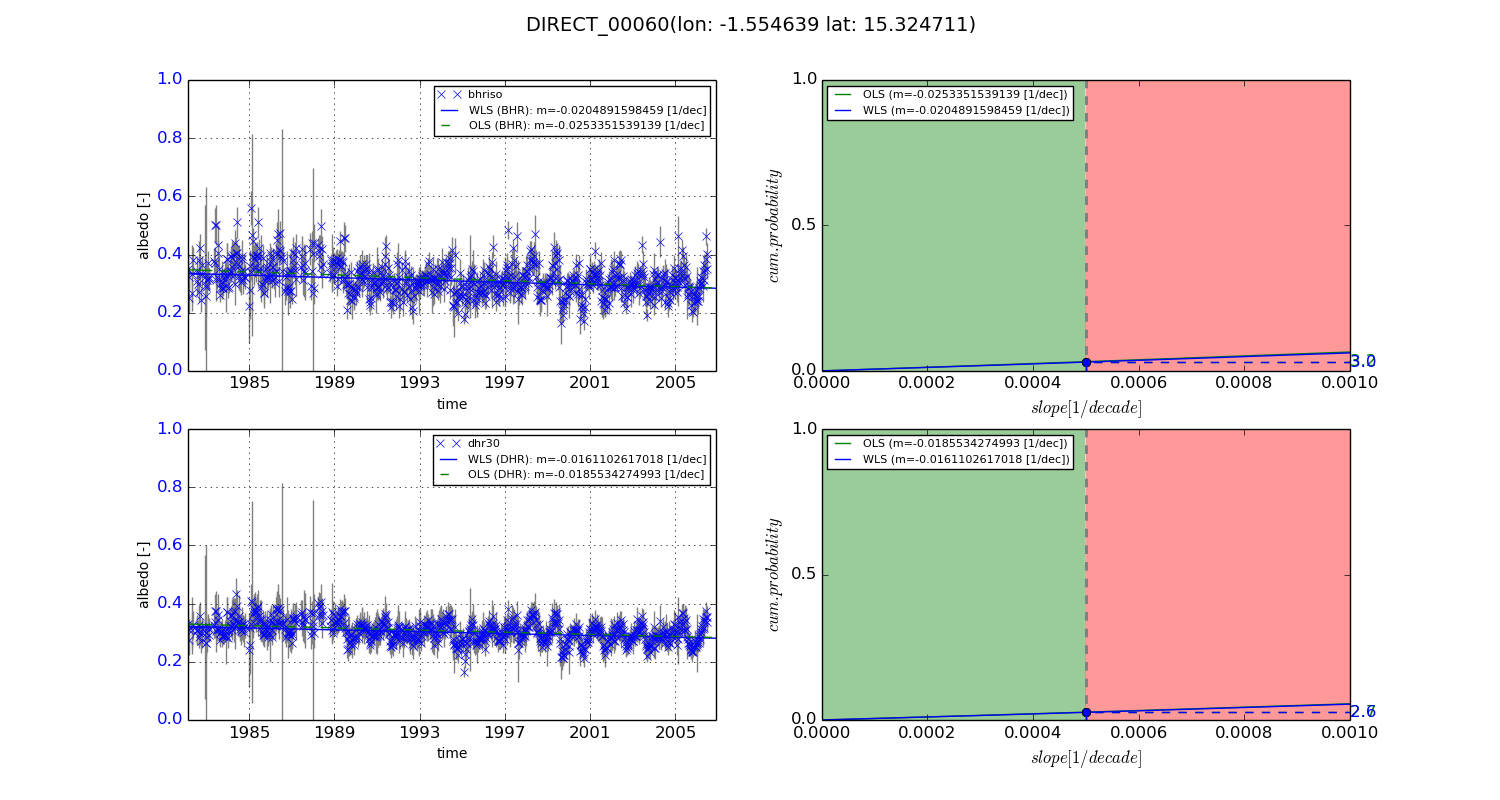
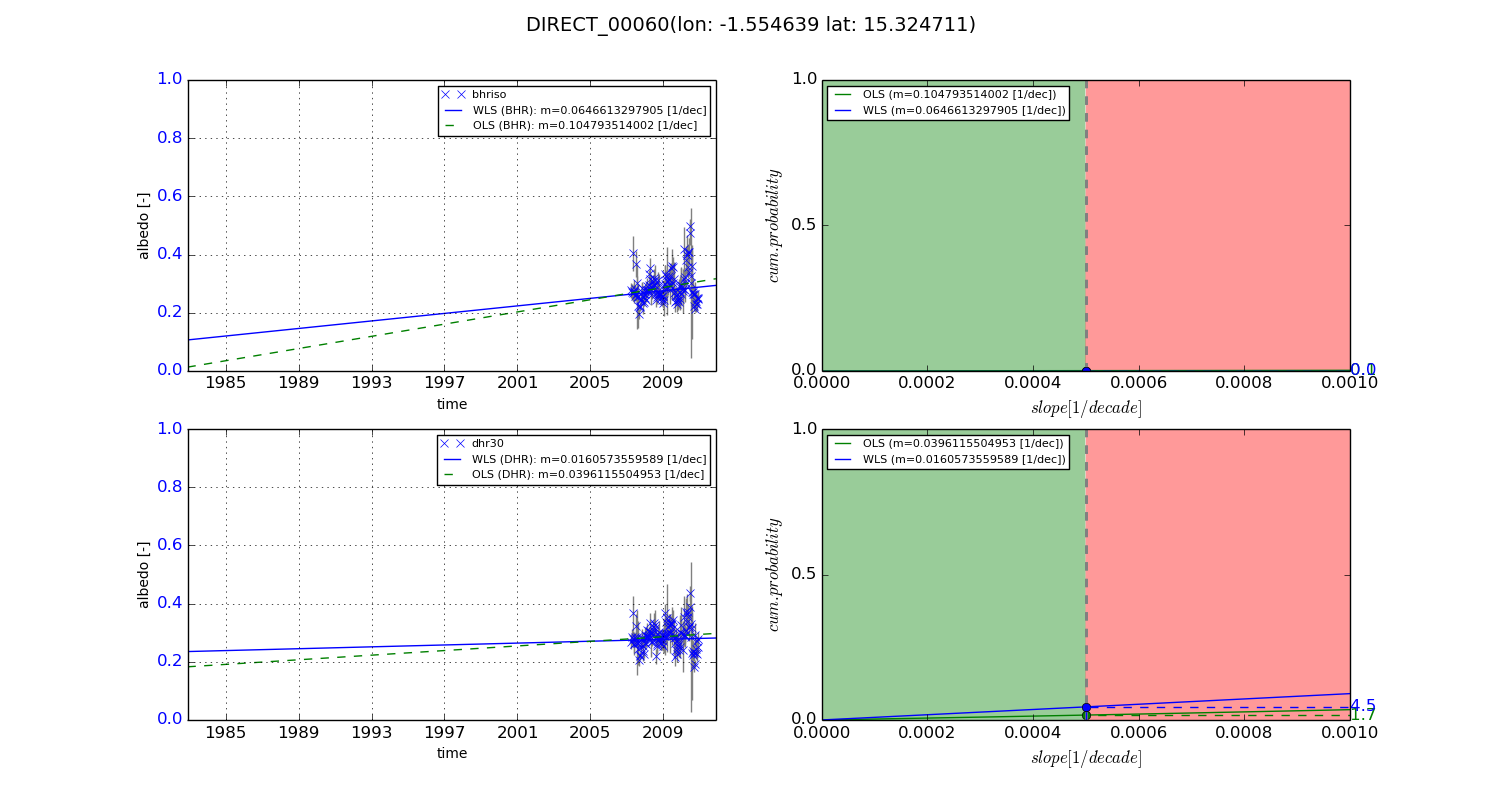
Temporal stability analysis

+000 deg (BHR)


BHR statistics

Temporal stability [1/decade]:


abs

rel


Weighted least square:

-0.0204891598459


Ordinary least square:

-0.0253351539139


Probabilities that GCOS criteria is met:

Weighted least square:

3.0 %

Ordinary least square:

3.2 %


DHR statistics

Temporal stability [1/decade]:


abs

rel


Weighted least square:

-0.0161102617018


Ordinary least square:

-0.0185534274993


Probabilities that GCOS criteria is met:

Weighted least square:

2.6 %

Ordinary least square:

2.7 %


+057/+063 deg (BHR)


BHR statistics

Temporal stability [1/decade]:


abs

rel


Weighted least square:

0.0646613297905


Ordinary least square:

0.104793514002


Probabilities that GCOS criteria is met:

Weighted least square:

0.0 %

Ordinary least square:

0.1 %


DHR statistics

Temporal stability [1/decade]:


abs

rel


Weighted least square:

0.0160573559589


Ordinary least square:

0.0396115504953


Probabilities that GCOS criteria is met:

Weighted least square:

4.5 %

Ordinary least square:

1.7 %


Temporal anomaly analyis

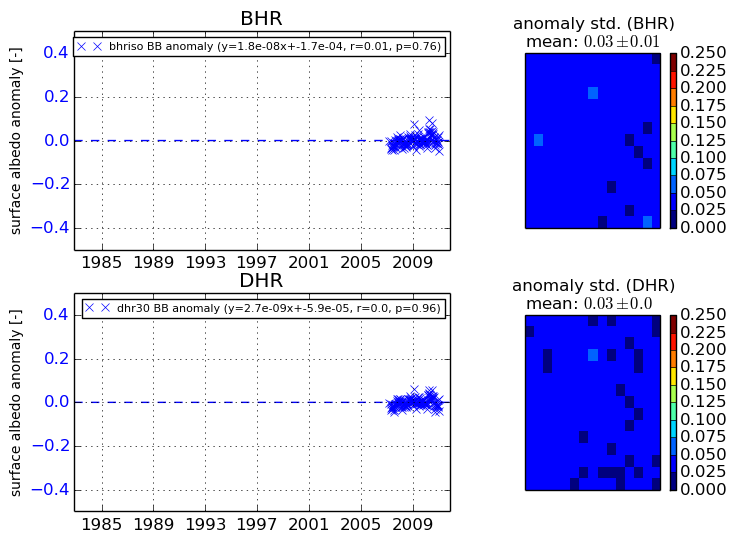
The variance of the temporal anomalies provides an additional measure about the stability of the signal AFTER removal of the mean seasonal cylce.
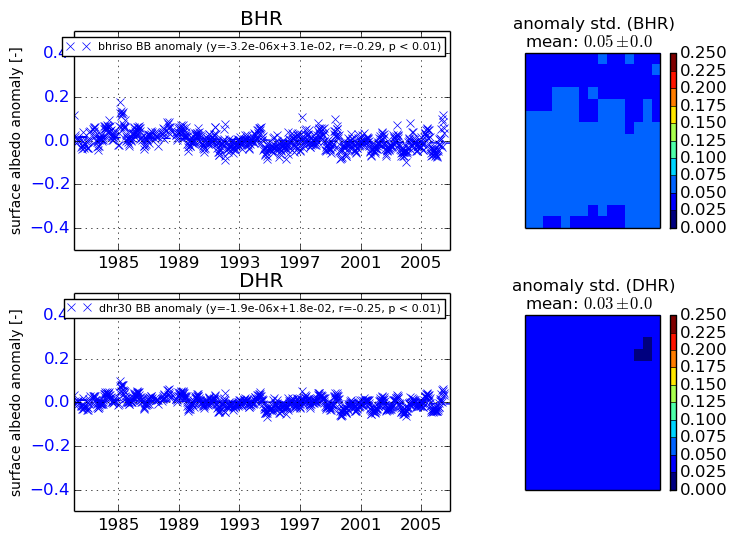
+000 deg


+057/+063 deg