DIRECT_00061


Location

lon / lat [deg]: -7.6003 / 31.6593

Source network: DIRECT


Geostationary surface albedo (GSA) data


“+000”


“+057/+063”


Landcover information (based on ESA CCI landcover data)


Landcover fractions @ 2km distance


Landcover fractions @ 20 km distance


Legend


Distance to open water bodies [km]:

7.8

Distance to urban areas [km]:

11.27


Radius: 1 km

Number of landcover classes:

1

Dominant landcover type:

10: cropland, rainfed

Fraction of dominant landcover type [%]:

100.0


Radius: 2 km

Number of landcover classes:

1

Dominant landcover type:

10: cropland, rainfed

Fraction of dominant landcover type [%]:

100.0


Radius: 5 km

Number of landcover classes:

2

Dominant landcover type:

10: cropland, rainfed

Fraction of dominant landcover type [%]:

93.0


Radius: 10 km

Number of landcover classes:

2

Dominant landcover type:

10: cropland, rainfed

Fraction of dominant landcover type [%]:

82.0


Radius: 20 km

Number of landcover classes:

2

Dominant landcover type:

10: cropland, rainfed

Fraction of dominant landcover type [%]:

72.0


Disturbances


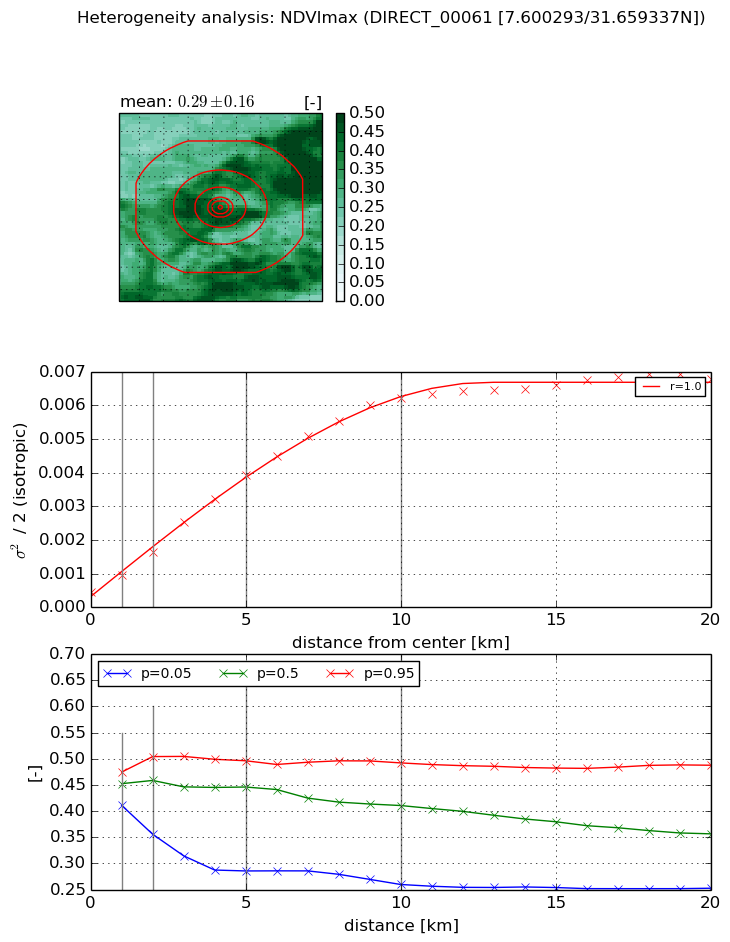
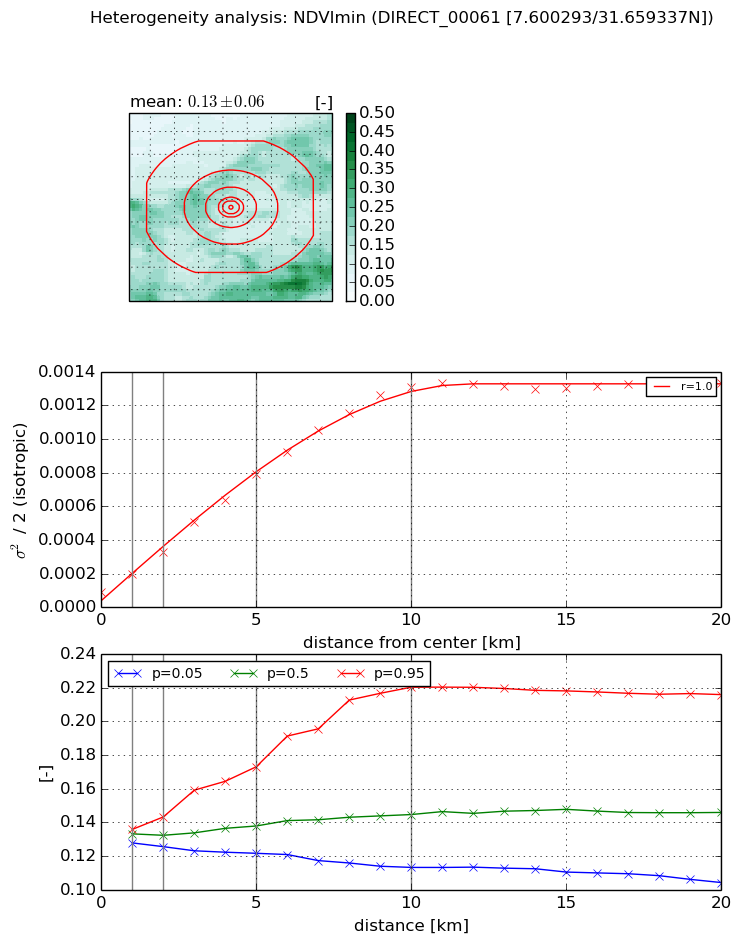
Heterogeneity analysis

The heterogeneity analysis provides information about the spatial and temporal heterogeneity of the site.

Topography


Roman et al. (2009) index


St

1.77725358842

Rcv

0.687996309866

Rse

0.0

Rst

-1.40733893964e-06

Rsv

-0.999999999912


Height range @ 1km [m]

12

Height range @ 2km [m]

25

Height range @ 5km [m]

67

Height range @ 10km [m]

-999

Height range @ 20km [m]

-999


Variance slope @ 1 km

24

Variance slope @ 2 km

43

Variance slope @ 5 km

93

Variance slope @ 10 km

-999

Variance slope @ 20 km

-999


NDVI (max. NDVI composite)


Roman et al. (2009) index


St

3.29649021268

Rcv

0.179957466414

Rse

0.0

Rst

0.0183814005719

Rsv

0.71171995511


NDVI range @ 1km [-]

0.06

NDVI range @ 2km [-]

0.15

NDVI range @ 5km [-]

0.21

NDVI range @ 10km [-]

0.23

NDVI range @ 20km [-]

0.24


Variance slope @ 1 km

0.000507720372099

Variance slope @ 2 km

0.000593013769102

Variance slope @ 5 km

0.000717685701486

Variance slope @ 10 km

0.000611008899748

Variance slope @ 20 km

0.000309522033837


NDVI (min. NDVI composite)I


Roman et al. (2009) index


St

3.52827593809

Rcv

0.478489062709

Rse

0.0

Rst

-0.266541039254

Rsv

0.105243531007


NDVI range @ 1km [-]

0.01

NDVI range @ 2km [-]

0.02

NDVI range @ 5km [-]

0.05

NDVI range @ 10km [-]

0.11

NDVI range @ 20km [-]

0.11


NDVI slope @ 1 km

0.000106581240718

NDVI slope @ 2 km

0.000120146895586

NDVI slope @ 5 km

0.000142865068762

NDVI slope @ 10 km

0.000129284024462

NDVI slope @ 20 km

5.97011801993e-05


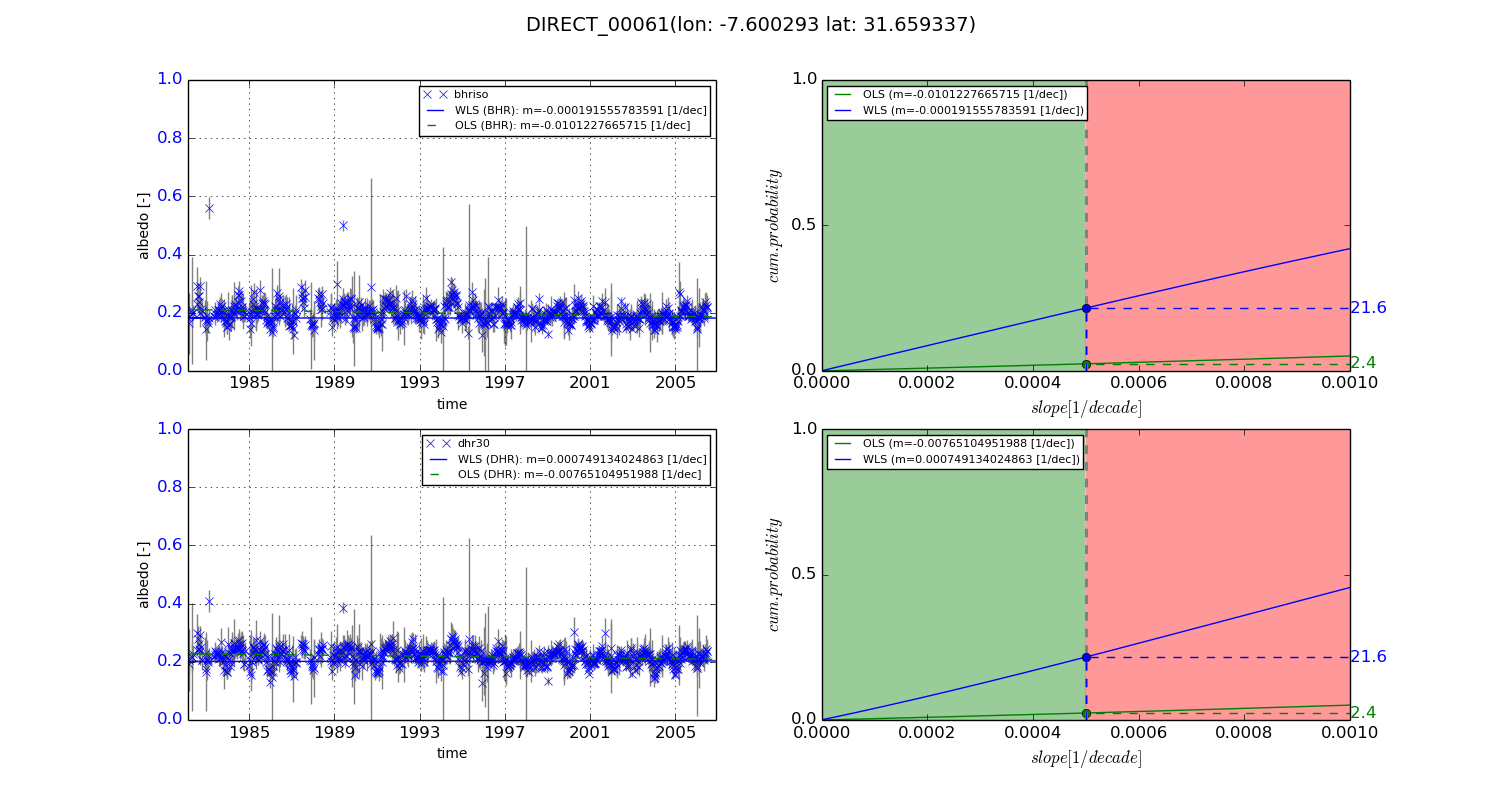
Temporal stability analysis

+000 deg (BHR)


BHR statistics

Temporal stability [1/decade]:


abs

rel


Weighted least square:

-0.000191555783591


Ordinary least square:

-0.0101227665715


Probabilities that GCOS criteria is met:

Weighted least square:

21.6 %

Ordinary least square:

2.4 %


DHR statistics

Temporal stability [1/decade]:


abs

rel


Weighted least square:

0.000749134024863


Ordinary least square:

-0.00765104951988


Probabilities that GCOS criteria is met:

Weighted least square:

21.6 %

Ordinary least square:

2.4 %


+057/+063 deg (BHR)


BHR statistics

Temporal stability [1/decade]:


abs

rel


Weighted least square:

-99999.0


Ordinary least square:

-99999.0


Probabilities that GCOS criteria is met:

Weighted least square:

-99999.0 %

Ordinary least square:

-99999.0 %


DHR statistics

Temporal stability [1/decade]:


abs

rel


Weighted least square:

-99999.0


Ordinary least square:

-99999.0


Probabilities that GCOS criteria is met:

Weighted least square:

-99999.0 %

Ordinary least square:

-99999.0 %


Temporal anomaly analyis

The variance of the temporal anomalies provides an additional measure about the stability of the signal AFTER removal of the mean seasonal cylce.
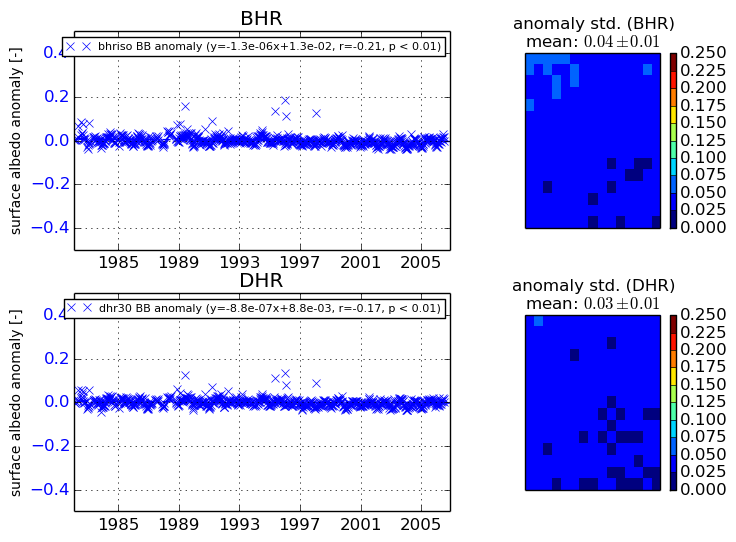
+000 deg


+057/+063 deg