DIRECT_00063


Location

lon / lat [deg]: -1.475 / 15.331

Source network: DIRECT


Geostationary surface albedo (GSA) data


“+000”


“+057/+063”


Landcover information (based on ESA CCI landcover data)


Landcover fractions @ 2km distance


Landcover fractions @ 20 km distance


Legend


Distance to open water bodies [km]:

3.67

Distance to urban areas [km]:

none in region


Radius: 1 km

Number of landcover classes:

1

Dominant landcover type:

130: grassland

Fraction of dominant landcover type [%]:

100.0


Radius: 2 km

Number of landcover classes:

3

Dominant landcover type:

130: grassland

Fraction of dominant landcover type [%]:

89.0


Radius: 5 km

Number of landcover classes:

4

Dominant landcover type:

130: grassland

Fraction of dominant landcover type [%]:

87.0


Radius: 10 km

Number of landcover classes:

4

Dominant landcover type:

130: grassland

Fraction of dominant landcover type [%]:

87.0


Radius: 20 km

Number of landcover classes:

4

Dominant landcover type:

130: grassland

Fraction of dominant landcover type [%]:

73.0


Disturbances


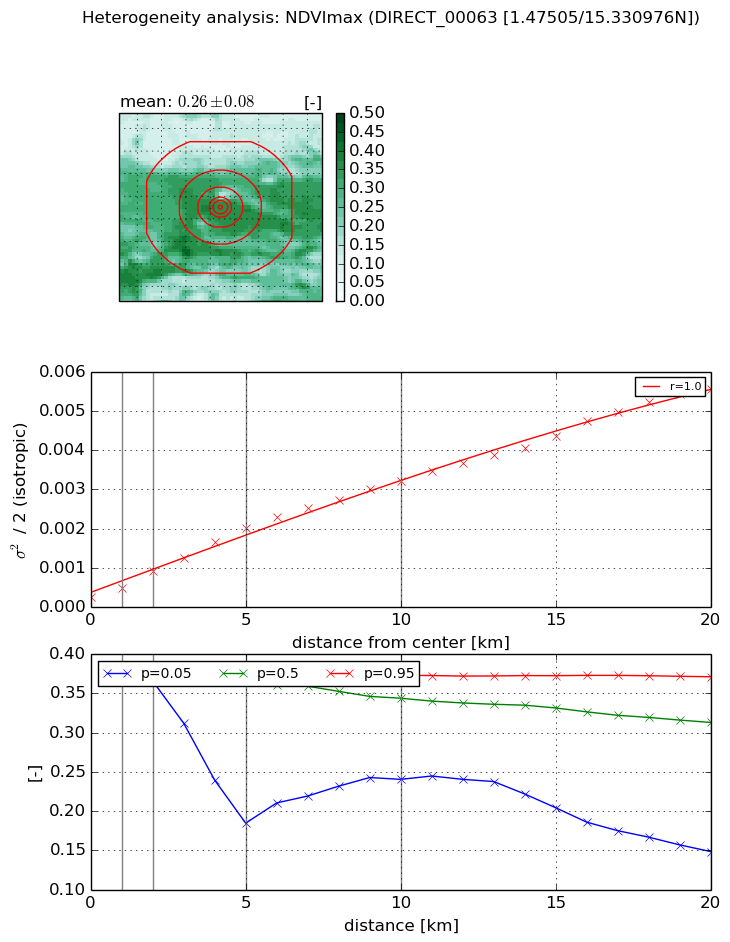
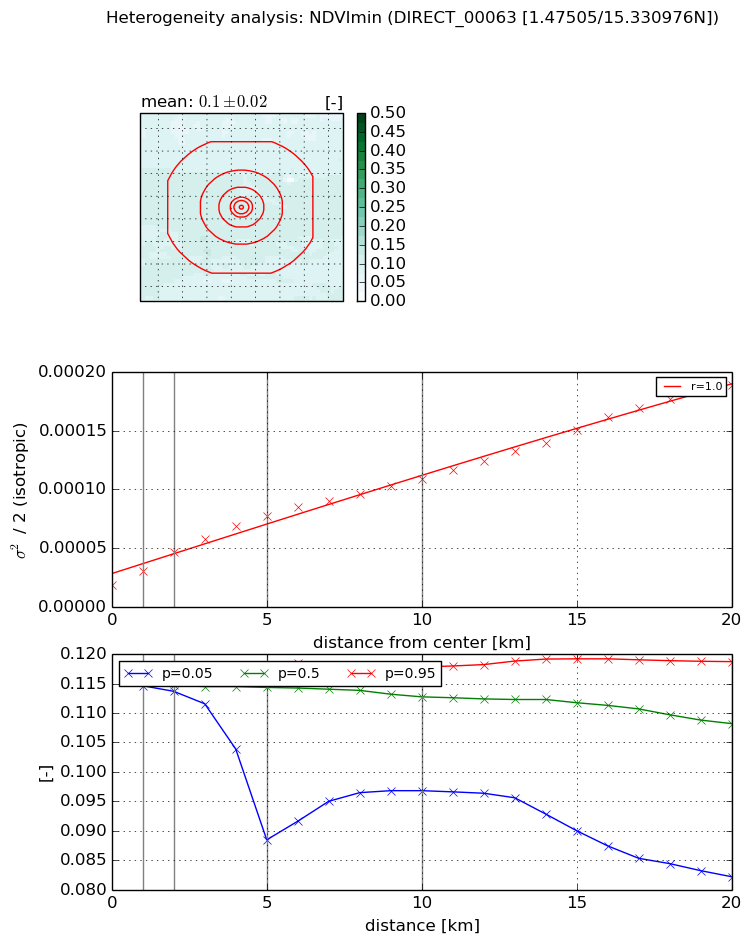
Heterogeneity analysis

The heterogeneity analysis provides information about the spatial and temporal heterogeneity of the site.

Topography


Roman et al. (2009) index


St

0.00194753345093

Rcv

0.58136267452

Rse

0.0

Rst

-0.0691414750747

Rsv

1539.75949424


Height range @ 1km [m]

15

Height range @ 2km [m]

17

Height range @ 5km [m]

47

Height range @ 10km [m]

-999

Height range @ 20km [m]

-999


Variance slope @ 1 km

64

Variance slope @ 2 km

63

Variance slope @ 5 km

37

Variance slope @ 10 km

-999

Variance slope @ 20 km

-999


NDVI (max. NDVI composite)


Roman et al. (2009) index


St

1.20489062622

Rcv

1.97142145708

Rse

0.0

Rst

0.058637065843

Rsv

0.45979402861


NDVI range @ 1km [-]

0.0

NDVI range @ 2km [-]

0.01

NDVI range @ 5km [-]

0.19

NDVI range @ 10km [-]

0.13

NDVI range @ 20km [-]

0.22


Variance slope @ 1 km

0.000238445335362

Variance slope @ 2 km

0.000329431350447

Variance slope @ 5 km

0.000360550718208

Variance slope @ 10 km

0.000304110199033

Variance slope @ 20 km

0.000261839021293


NDVI (min. NDVI composite)I


Roman et al. (2009) index


St

0.530656713383

Rcv

5.58770492278

Rse

0.0

Rst

-0.0490516404834

Rsv

-0.0166158041159


NDVI range @ 1km [-]

0.0

NDVI range @ 2km [-]

0.0

NDVI range @ 5km [-]

0.03

NDVI range @ 10km [-]

0.02

NDVI range @ 20km [-]

0.04


NDVI slope @ 1 km

1.17907279709e-05

NDVI slope @ 2 km

1.39274579224e-05

NDVI slope @ 5 km

1.19093739513e-05

NDVI slope @ 10 km

8.74862184566e-06

NDVI slope @ 20 km

8.09716335705e-06


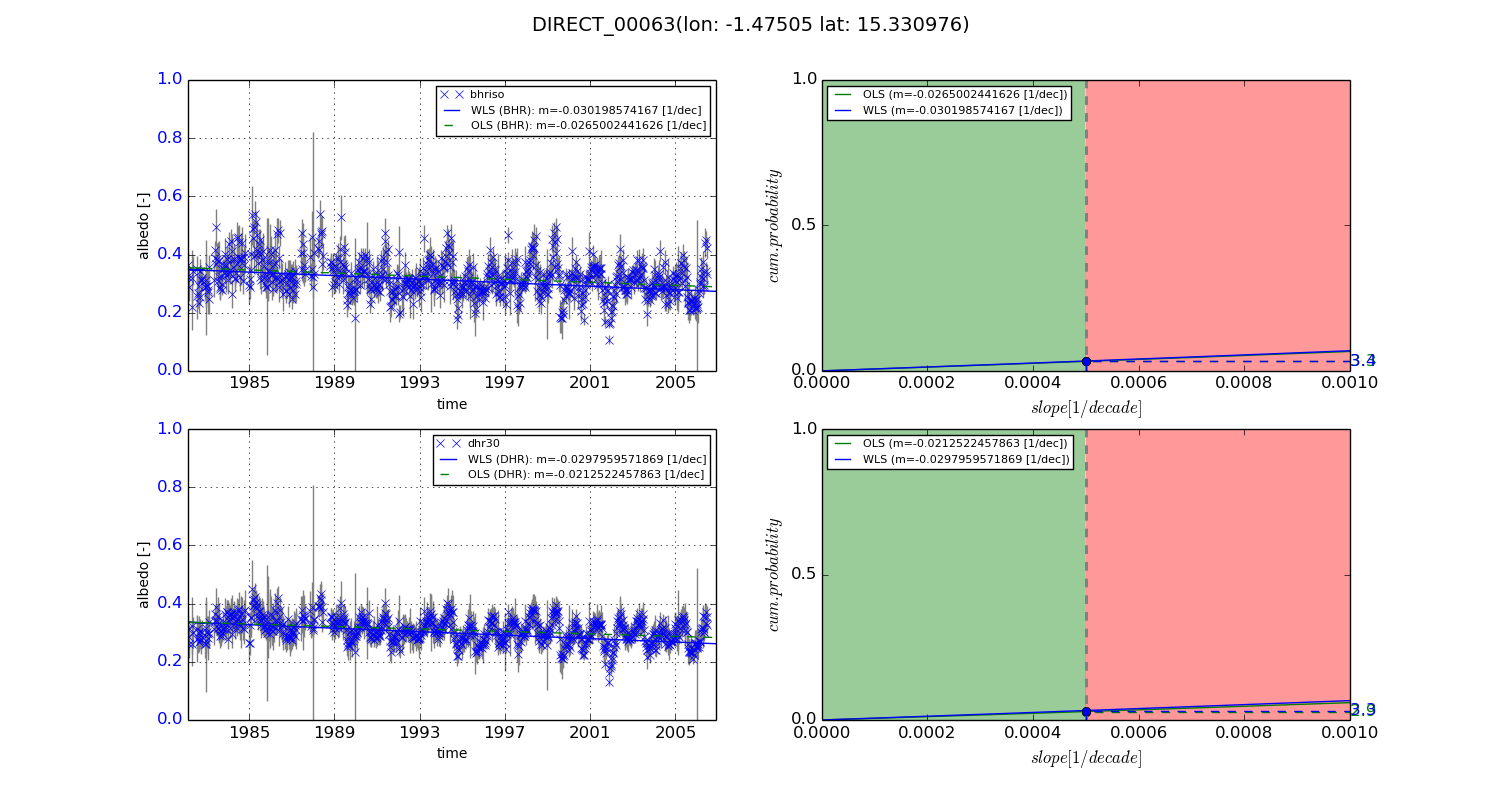
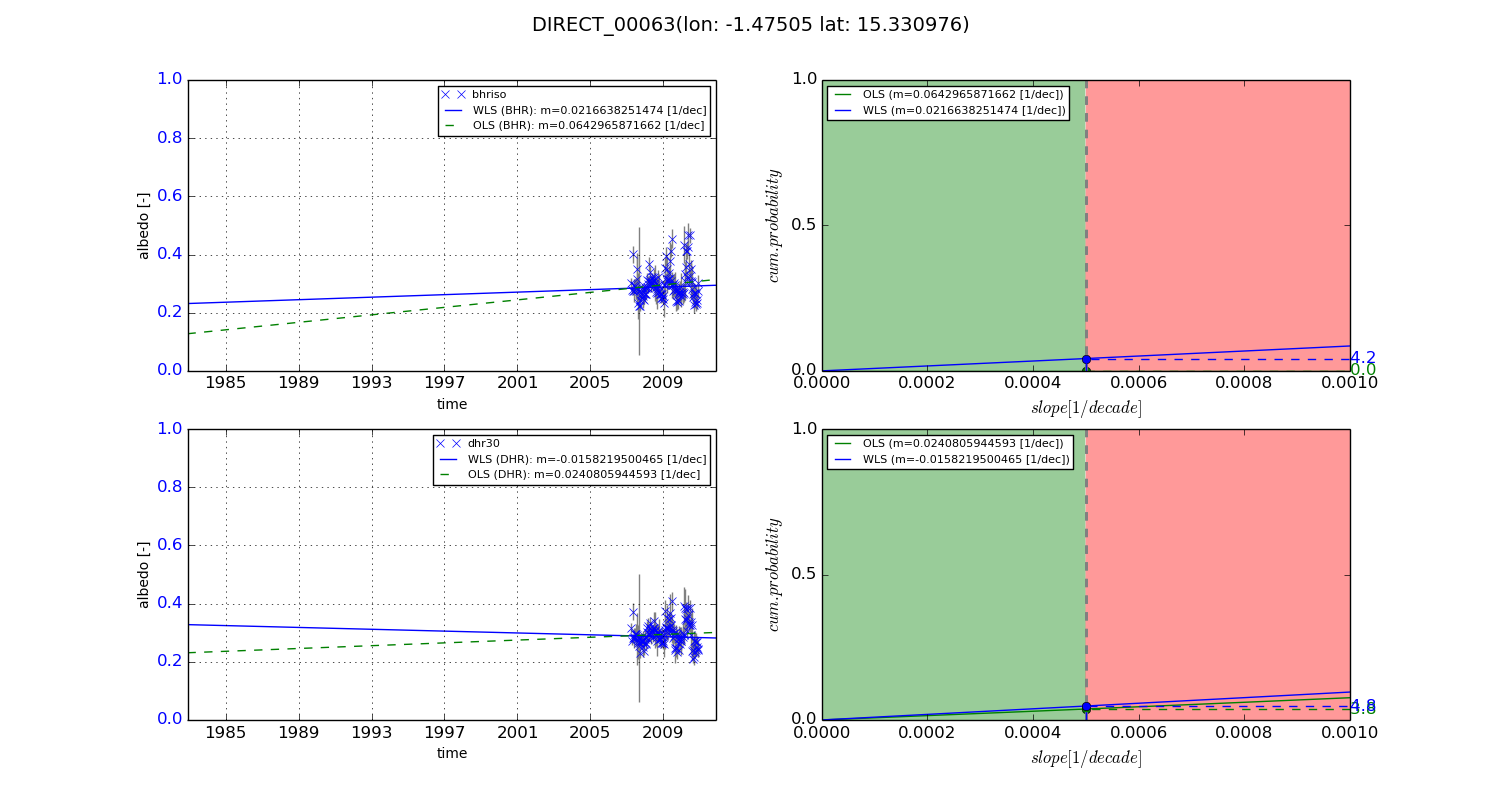
Temporal stability analysis

+000 deg (BHR)


BHR statistics

Temporal stability [1/decade]:


abs

rel


Weighted least square:

-0.030198574167


Ordinary least square:

-0.0265002441626


Probabilities that GCOS criteria is met:

Weighted least square:

3.4 %

Ordinary least square:

3.3 %


DHR statistics

Temporal stability [1/decade]:


abs

rel


Weighted least square:

-0.0297959571869


Ordinary least square:

-0.0212522457863


Probabilities that GCOS criteria is met:

Weighted least square:

3.3 %

Ordinary least square:

2.9 %


+057/+063 deg (BHR)


BHR statistics

Temporal stability [1/decade]:


abs

rel


Weighted least square:

0.0216638251474


Ordinary least square:

0.0642965871662


Probabilities that GCOS criteria is met:

Weighted least square:

4.2 %

Ordinary least square:

0.0 %


DHR statistics

Temporal stability [1/decade]:


abs

rel


Weighted least square:

-0.0158219500465


Ordinary least square:

0.0240805944593


Probabilities that GCOS criteria is met:

Weighted least square:

4.8 %

Ordinary least square:

3.8 %


Temporal anomaly analyis

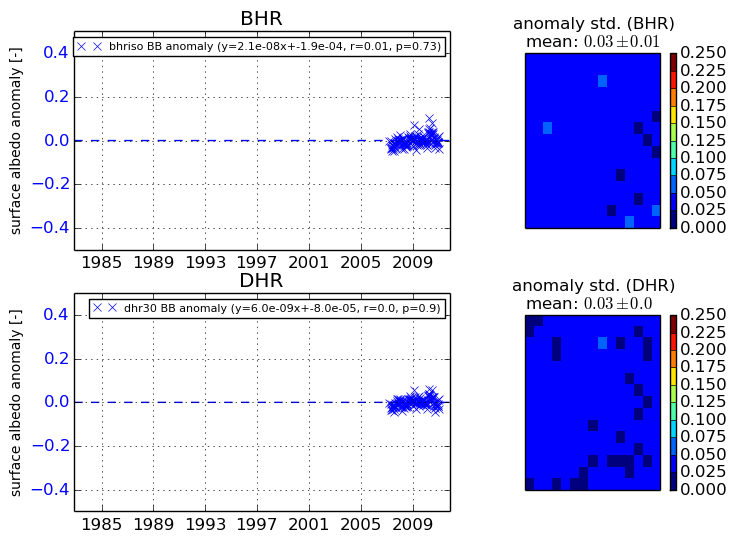
The variance of the temporal anomalies provides an additional measure about the stability of the signal AFTER removal of the mean seasonal cylce.
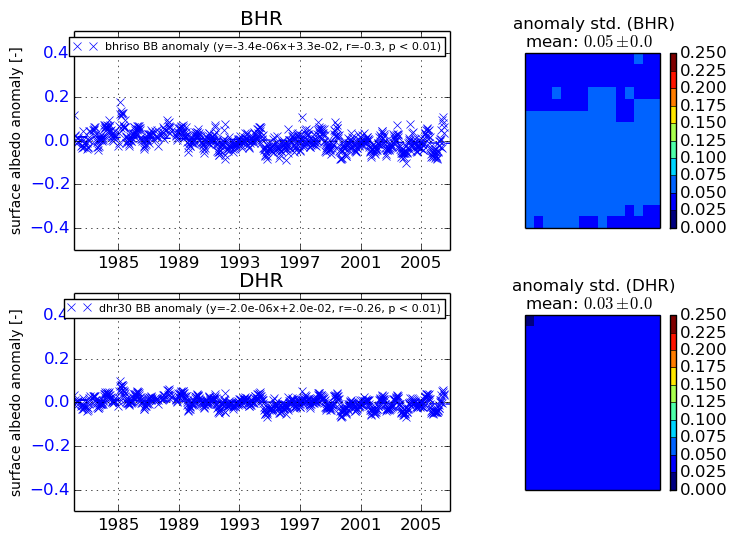
+000 deg


+057/+063 deg