DIRECT_00064


Location

lon / lat [deg]: 27.2623 / 58.2987

Source network: DIRECT


Geostationary surface albedo (GSA) data


“+000”


“+057/+063”


Landcover information (based on ESA CCI landcover data)


Landcover fractions @ 2km distance


Landcover fractions @ 20 km distance


Legend


Distance to open water bodies [km]:

4.91

Distance to urban areas [km]:

4.3


Radius: 1 km

Number of landcover classes:

3

Dominant landcover type:

90: Tree cover, mixed leaf type

Fraction of dominant landcover type [%]:

62.0


Radius: 2 km

Number of landcover classes:

4

Dominant landcover type:

90: Tree cover, mixed leaf type

Fraction of dominant landcover type [%]:

59.0


Radius: 5 km

Number of landcover classes:

5

Dominant landcover type:

90: Tree cover, mixed leaf type

Fraction of dominant landcover type [%]:

42.0


Radius: 10 km

Number of landcover classes:

6

Dominant landcover type:

60: Tree cover, broadleaved, decidous

Fraction of dominant landcover type [%]:

25.0


Radius: 20 km

Number of landcover classes:

9

Dominant landcover type:

210: water bodies

Fraction of dominant landcover type [%]:

23.0


Disturbances


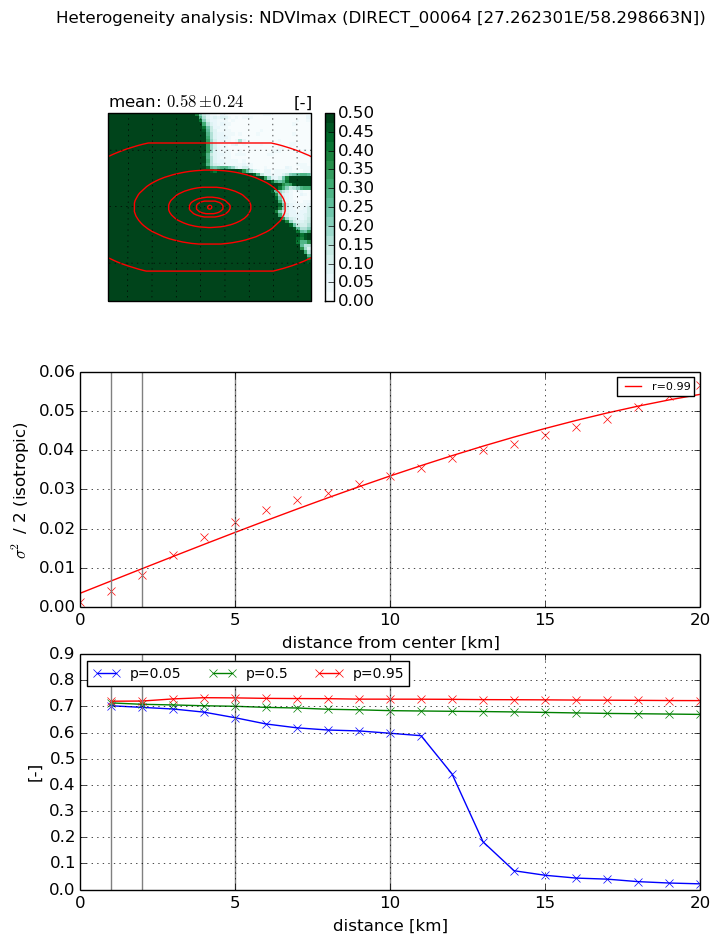
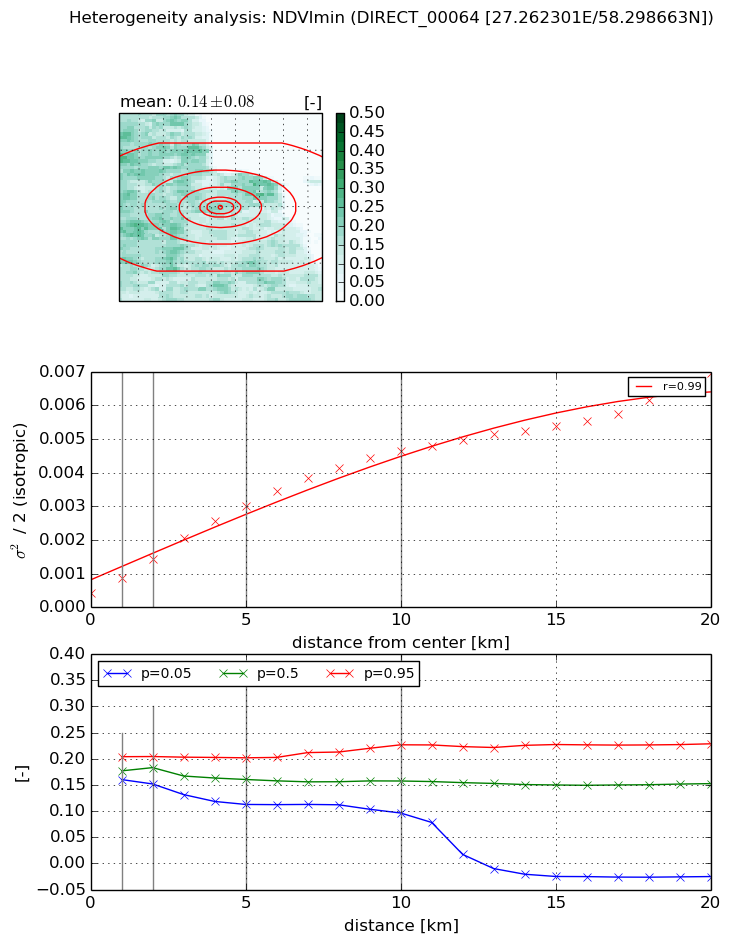
Heterogeneity analysis

The heterogeneity analysis provides information about the spatial and temporal heterogeneity of the site.

Topography


Roman et al. (2009) index


St

0.00202903687132

Rcv

0.314269602016

Rse

0.0

Rst

-0.338877430634

Rsv

1477.88085223


Height range @ 1km [m]

14

Height range @ 2km [m]

13

Height range @ 5km [m]

18

Height range @ 10km [m]

-999

Height range @ 20km [m]

-999


Variance slope @ 1 km

13

Variance slope @ 2 km

7

Variance slope @ 5 km

4

Variance slope @ 10 km

-999

Variance slope @ 20 km

-999


NDVI (max. NDVI composite)


Roman et al. (2009) index


St

5.92064046296e-07

Rcv

0.939246839273

Rse

0.0

Rst

0.0145898126352

Rsv

5067018.43159


NDVI range @ 1km [-]

0.02

NDVI range @ 2km [-]

0.02

NDVI range @ 5km [-]

0.08

NDVI range @ 10km [-]

0.13

NDVI range @ 20km [-]

0.7


Variance slope @ 1 km

0.00280201652359

Variance slope @ 2 km

0.00342557548484

Variance slope @ 5 km

0.00421190797983

Variance slope @ 10 km

0.00333021863054

Variance slope @ 20 km

0.00258806046286


NDVI (min. NDVI composite)I


Roman et al. (2009) index


St

1.24465673995

Rcv

0.236443512054

Rse

0.0

Rst

-0.504766437236

Rsv

1.66909315173


NDVI range @ 1km [-]

0.04

NDVI range @ 2km [-]

0.05

NDVI range @ 5km [-]

0.09

NDVI range @ 10km [-]

0.13

NDVI range @ 20km [-]

0.25


NDVI slope @ 1 km

0.000443592847359

NDVI slope @ 2 km

0.000494506156474

NDVI slope @ 5 km

0.000533511280046

NDVI slope @ 10 km

0.000435742908276

NDVI slope @ 20 km

0.000289592537336


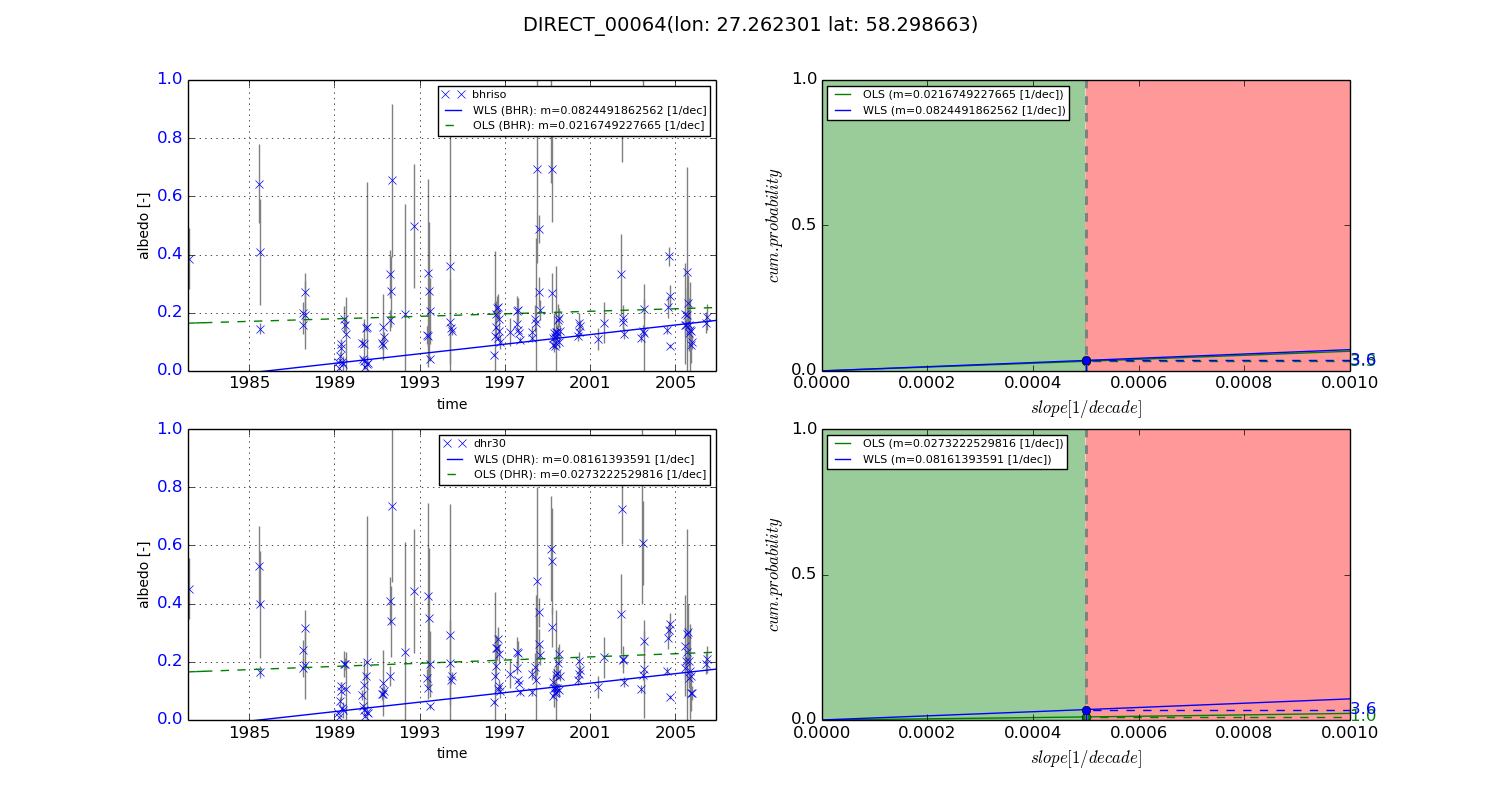
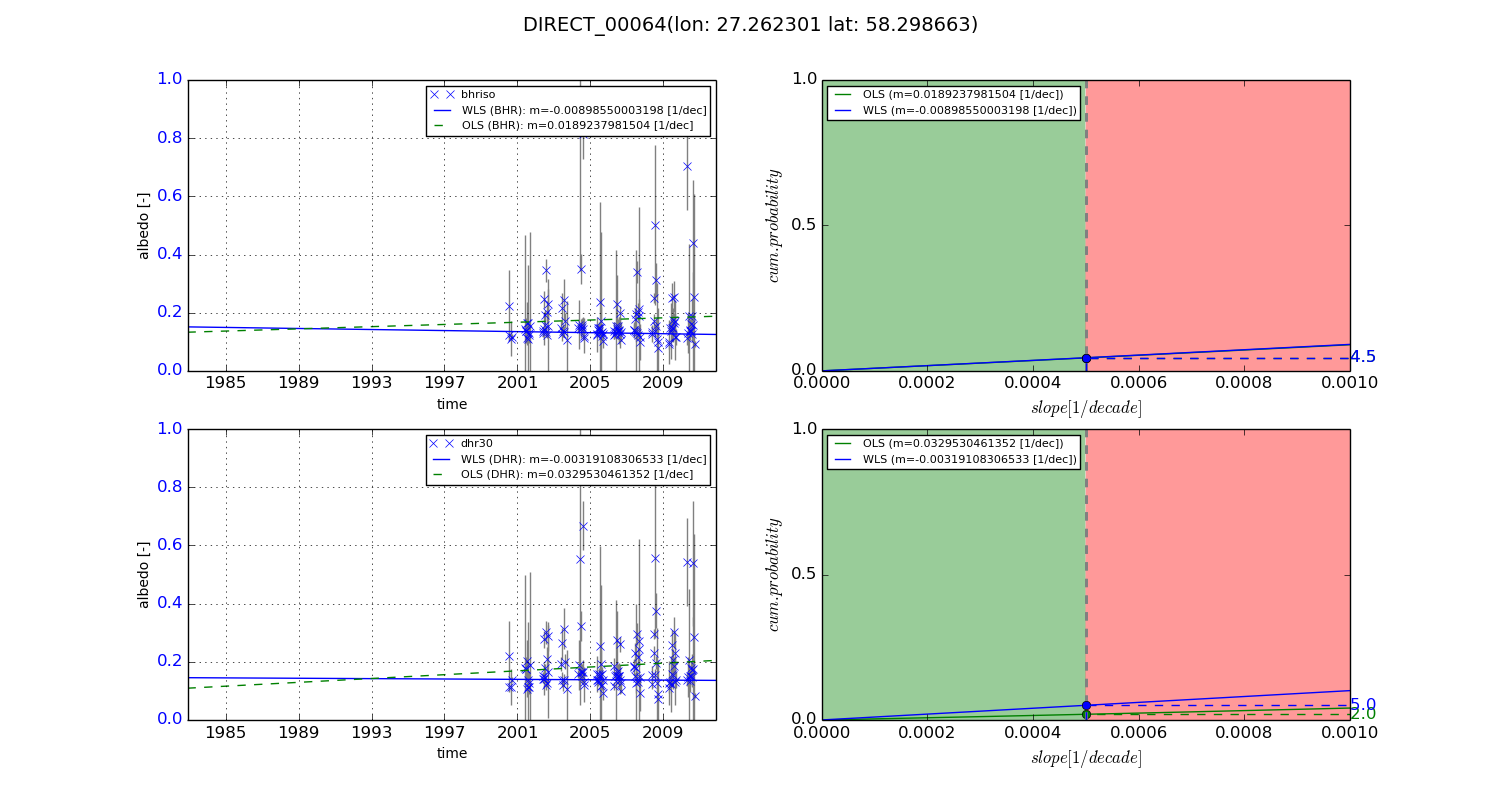
Temporal stability analysis

+000 deg (BHR)


BHR statistics

Temporal stability [1/decade]:


abs

rel


Weighted least square:

0.0824491862562


Ordinary least square:

0.0216749227665


Probabilities that GCOS criteria is met:

Weighted least square:

3.6 %

Ordinary least square:

3.3 %


DHR statistics

Temporal stability [1/decade]:


abs

rel


Weighted least square:

0.08161393591


Ordinary least square:

0.0273222529816


Probabilities that GCOS criteria is met:

Weighted least square:

3.6 %

Ordinary least square:

1.0 %


+057/+063 deg (BHR)


BHR statistics

Temporal stability [1/decade]:


abs

rel


Weighted least square:

-0.00898550003198


Ordinary least square:

0.0189237981504


Probabilities that GCOS criteria is met:

Weighted least square:

4.5 %

Ordinary least square:

4.5 %


DHR statistics

Temporal stability [1/decade]:


abs

rel


Weighted least square:

-0.00319108306533


Ordinary least square:

0.0329530461352


Probabilities that GCOS criteria is met:

Weighted least square:

5.0 %

Ordinary least square:

2.0 %


Temporal anomaly analyis

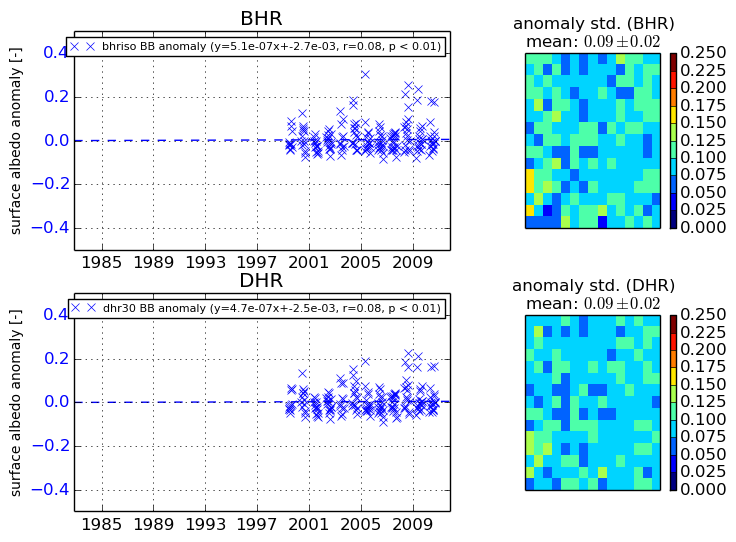
The variance of the temporal anomalies provides an additional measure about the stability of the signal AFTER removal of the mean seasonal cylce.
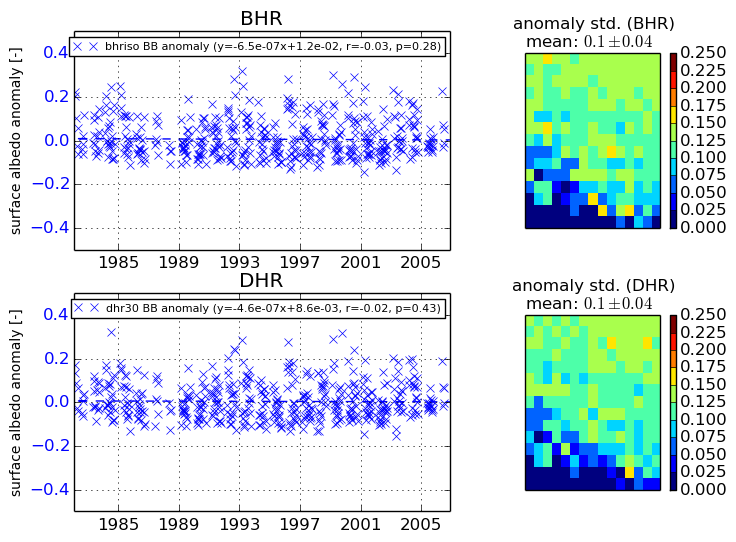
+000 deg


+057/+063 deg