DIRECT_00071


Location

lon / lat [deg]: 3.772 / 48.4432

Source network: DIRECT


Geostationary surface albedo (GSA) data


“+000”


“+057/+063”


Landcover information (based on ESA CCI landcover data)


Landcover fractions @ 2km distance


Landcover fractions @ 20 km distance


Legend


Distance to open water bodies [km]:

9.38

Distance to urban areas [km]:

2.16


Radius: 1 km

Number of landcover classes:

1

Dominant landcover type:

10: cropland, rainfed

Fraction of dominant landcover type [%]:

100.0


Radius: 2 km

Number of landcover classes:

1

Dominant landcover type:

10: cropland, rainfed

Fraction of dominant landcover type [%]:

100.0


Radius: 5 km

Number of landcover classes:

2

Dominant landcover type:

10: cropland, rainfed

Fraction of dominant landcover type [%]:

97.0


Radius: 10 km

Number of landcover classes:

3

Dominant landcover type:

10: cropland, rainfed

Fraction of dominant landcover type [%]:

89.0


Radius: 20 km

Number of landcover classes:

3

Dominant landcover type:

10: cropland, rainfed

Fraction of dominant landcover type [%]:

88.0


Disturbances


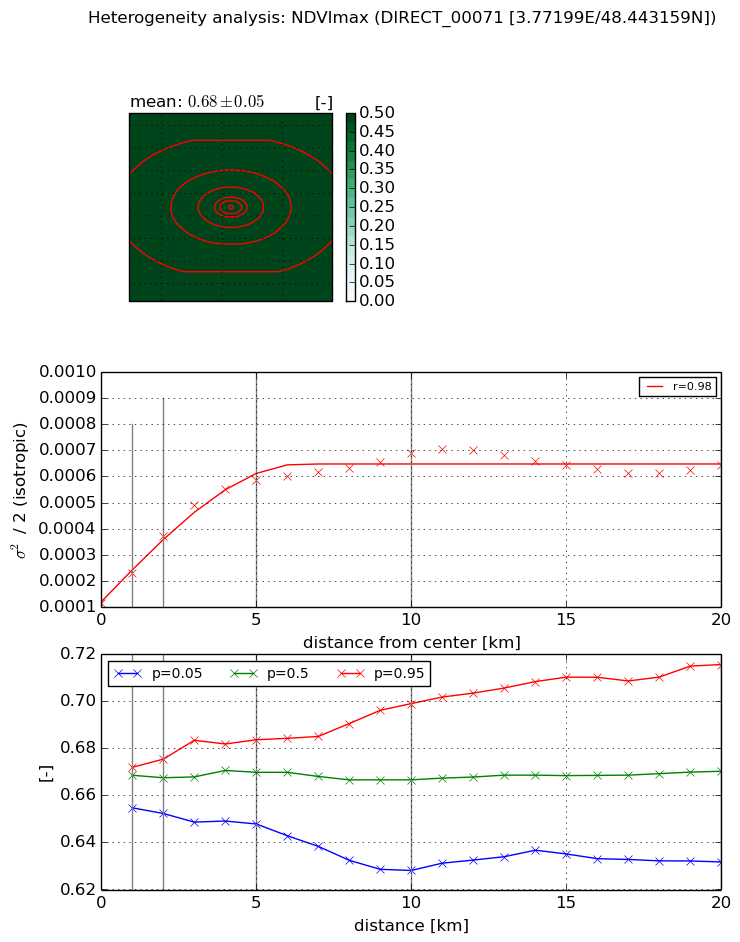
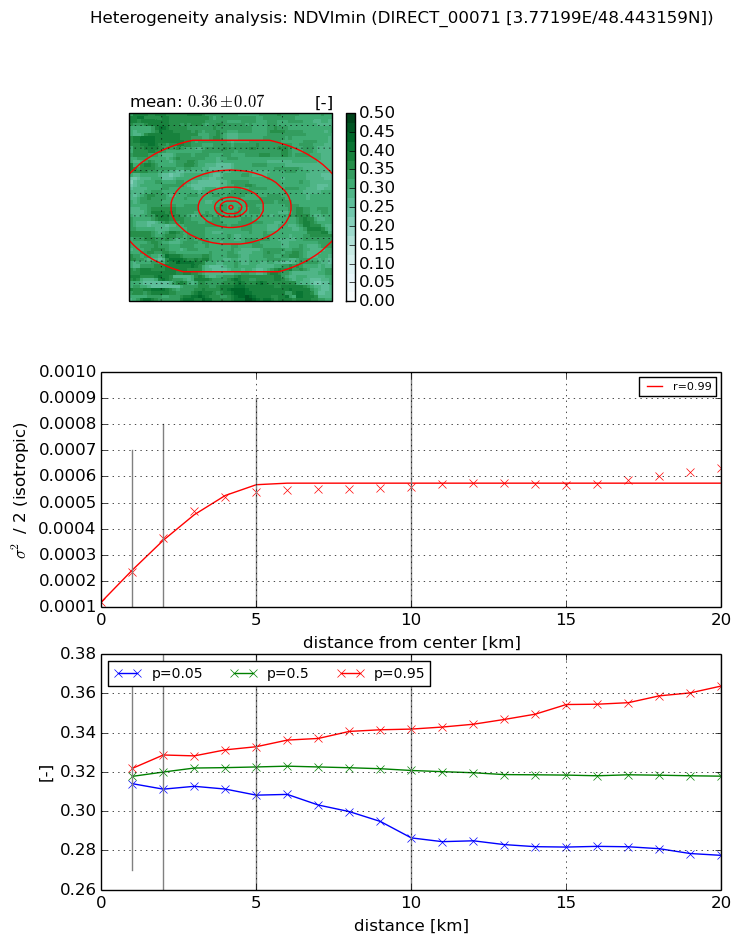
Heterogeneity analysis

The heterogeneity analysis provides information about the spatial and temporal heterogeneity of the site.

Topography


Roman et al. (2009) index


St

0.000304881916466

Rcv

0.464346192513

Rse

0.0

Rst

8.19489143211e-10

Rsv

9839.41082506


Height range @ 1km [m]

12

Height range @ 2km [m]

26

Height range @ 5km [m]

58

Height range @ 10km [m]

-999

Height range @ 20km [m]

-999


Variance slope @ 1 km

73

Variance slope @ 2 km

79

Variance slope @ 5 km

62

Variance slope @ 10 km

-999

Variance slope @ 20 km

-999


NDVI (max. NDVI composite)


Roman et al. (2009) index


St

1.99154859315

Rcv

0.0725753985248

Rse

0.0

Rst

-0.43379081107

Rsv

-0.999999244059


NDVI range @ 1km [-]

0.02

NDVI range @ 2km [-]

0.02

NDVI range @ 5km [-]

0.04

NDVI range @ 10km [-]

0.07

NDVI range @ 20km [-]

0.08


Variance slope @ 1 km

0.000114343550317

Variance slope @ 2 km

0.000128023203998

Variance slope @ 5 km

9.81957171228e-05

Variance slope @ 10 km

5.15425183312e-05

Variance slope @ 20 km

1.68299989278e-05


NDVI (min. NDVI composite)I


Roman et al. (2009) index


St

nan

Rcv

nan

Rse

nan

Rst

nan

Rsv

nan


NDVI range @ 1km [-]

0.01

NDVI range @ 2km [-]

0.02

NDVI range @ 5km [-]

0.02

NDVI range @ 10km [-]

0.06

NDVI range @ 20km [-]

0.09


NDVI slope @ 1 km

0.000116508552537

NDVI slope @ 2 km

0.000123114451204

NDVI slope @ 5 km

8.77572580269e-05

NDVI slope @ 10 km

3.86739024655e-05

NDVI slope @ 20 km

1.55407690628e-05


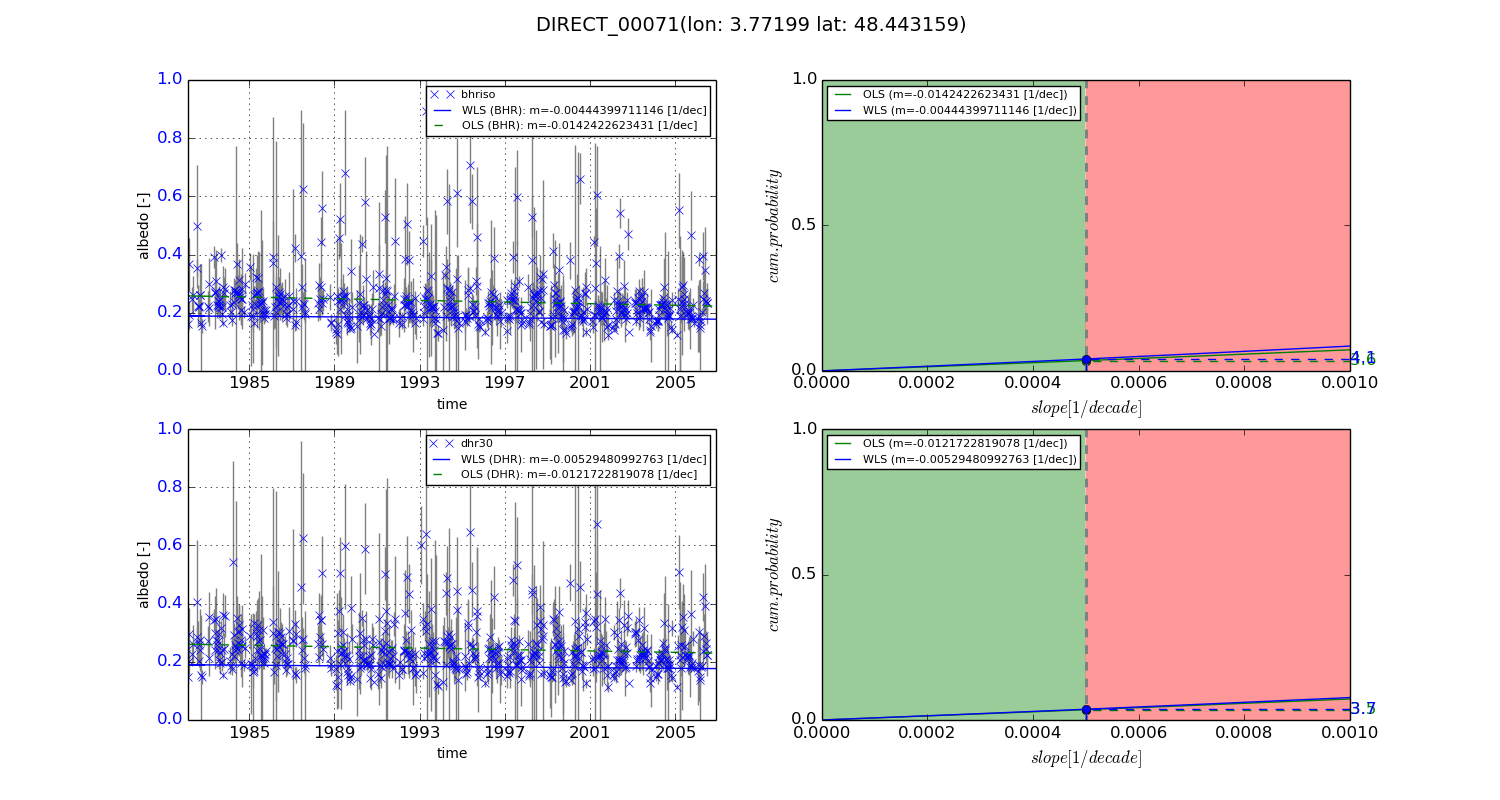
Temporal stability analysis

+000 deg (BHR)


BHR statistics

Temporal stability [1/decade]:


abs

rel


Weighted least square:

-0.00444399711146


Ordinary least square:

-0.0142422623431


Probabilities that GCOS criteria is met:

Weighted least square:

4.1 %

Ordinary least square:

3.6 %


DHR statistics

Temporal stability [1/decade]:


abs

rel


Weighted least square:

-0.00529480992763


Ordinary least square:

-0.0121722819078


Probabilities that GCOS criteria is met:

Weighted least square:

3.7 %

Ordinary least square:

3.5 %


+057/+063 deg (BHR)


BHR statistics

Temporal stability [1/decade]:


abs

rel


Weighted least square:

-99999.0


Ordinary least square:

-99999.0


Probabilities that GCOS criteria is met:

Weighted least square:

-99999.0 %

Ordinary least square:

-99999.0 %


DHR statistics

Temporal stability [1/decade]:


abs

rel


Weighted least square:

-99999.0


Ordinary least square:

-99999.0


Probabilities that GCOS criteria is met:

Weighted least square:

-99999.0 %

Ordinary least square:

-99999.0 %


Temporal anomaly analyis

The variance of the temporal anomalies provides an additional measure about the stability of the signal AFTER removal of the mean seasonal cylce.
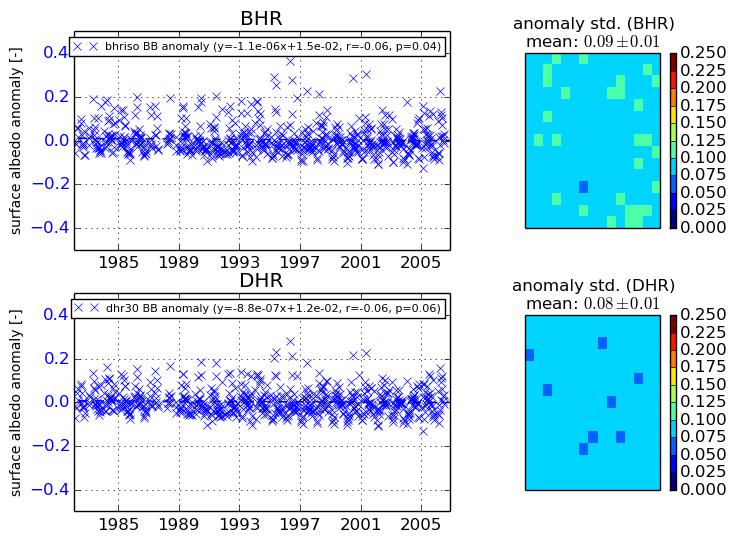
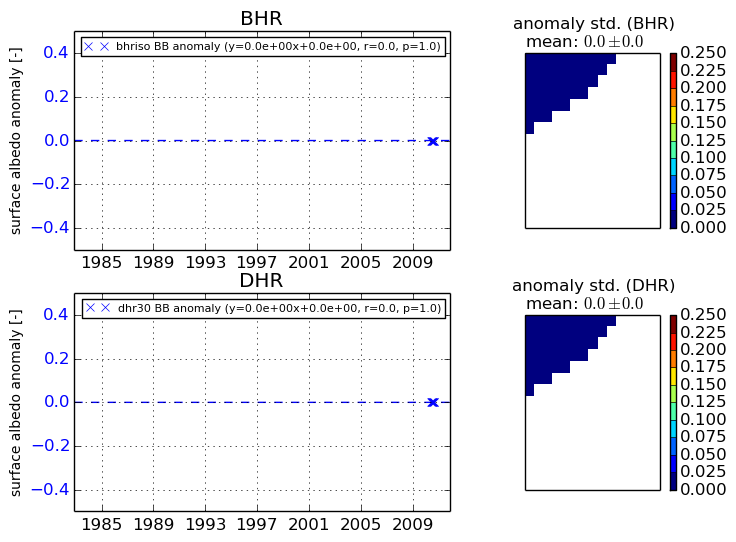
+000 deg


+057/+063 deg