DIRECT_00073


Location

lon / lat [deg]: 4.4111 / 50.7682

Source network: DIRECT


Geostationary surface albedo (GSA) data


“+000”


“+057/+063”


Landcover information (based on ESA CCI landcover data)


Landcover fractions @ 2km distance


Landcover fractions @ 20 km distance


Legend


Distance to open water bodies [km]:

8.71

Distance to urban areas [km]:

0.88


Radius: 1 km

Number of landcover classes:

2

Dominant landcover type:

60: Tree cover, broadleaved, decidous

Fraction of dominant landcover type [%]:

98.0


Radius: 2 km

Number of landcover classes:

2

Dominant landcover type:

60: Tree cover, broadleaved, decidous

Fraction of dominant landcover type [%]:

75.0


Radius: 5 km

Number of landcover classes:

4

Dominant landcover type:

190: urban areas

Fraction of dominant landcover type [%]:

62.0


Radius: 10 km

Number of landcover classes:

4

Dominant landcover type:

190: urban areas

Fraction of dominant landcover type [%]:

74.0


Radius: 20 km

Number of landcover classes:

5

Dominant landcover type:

190: urban areas

Fraction of dominant landcover type [%]:

57.0


Disturbances


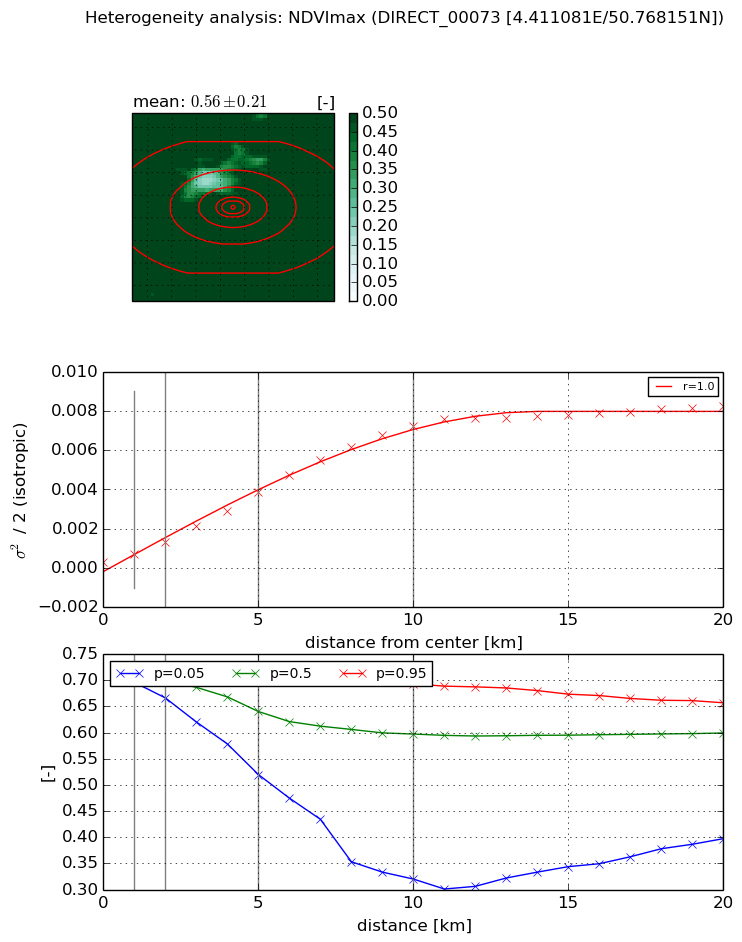
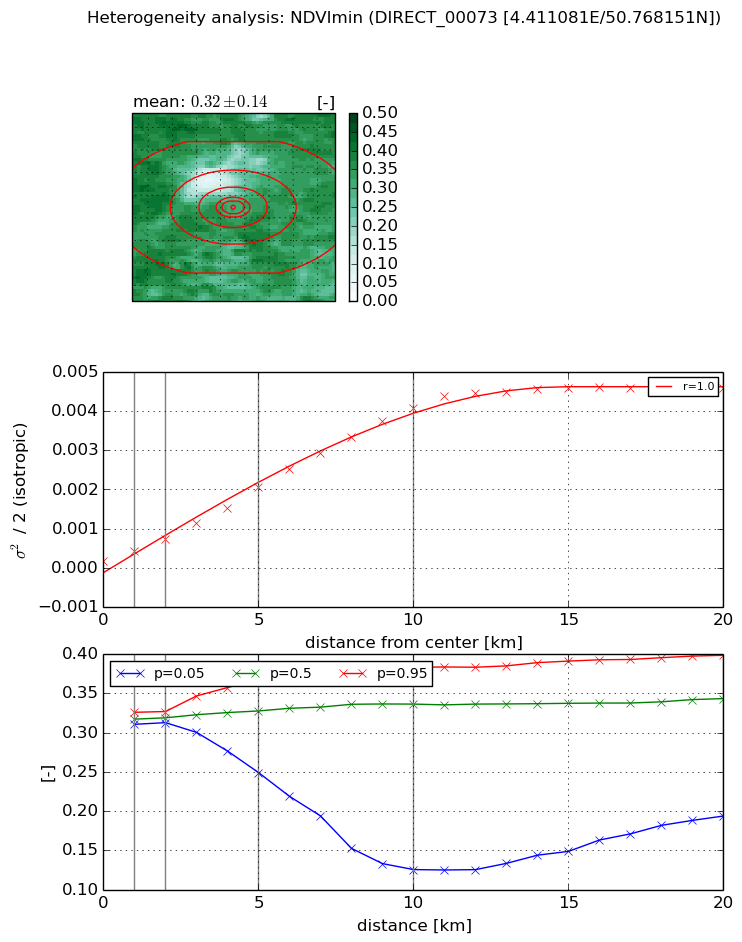
Heterogeneity analysis

The heterogeneity analysis provides information about the spatial and temporal heterogeneity of the site.

Topography


Roman et al. (2009) index


St

7.74538036814e-07

Rcv

0.47002410204

Rse

0.0

Rst

0.00466801175133

Rsv

3873276.05585


Height range @ 1km [m]

26

Height range @ 2km [m]

29

Height range @ 5km [m]

58

Height range @ 10km [m]

-999

Height range @ 20km [m]

-999


Variance slope @ 1 km

148

Variance slope @ 2 km

133

Variance slope @ 5 km

83

Variance slope @ 10 km

-999

Variance slope @ 20 km

-999


NDVI (max. NDVI composite)


Roman et al. (2009) index


St

2.03310192433

Rcv

1.31848909765

Rse

0.0

Rst

0.114140908216

Rsv

0.0429477623168


NDVI range @ 1km [-]

0.01

NDVI range @ 2km [-]

0.05

NDVI range @ 5km [-]

0.18

NDVI range @ 10km [-]

0.37

NDVI range @ 20km [-]

0.26


Variance slope @ 1 km

0.000402352023934

Variance slope @ 2 km

0.000501659090533

Variance slope @ 5 km

0.000726937344335

Variance slope @ 10 km

0.000746624070832

Variance slope @ 20 km

0.000407623849467


NDVI (min. NDVI composite)I


Roman et al. (2009) index


St

1.47575470193

Rcv

1.87436182213

Rse

0.0

Rst

-0.0247900937281

Rsv

-0.133706252295


NDVI range @ 1km [-]

0.02

NDVI range @ 2km [-]

0.01

NDVI range @ 5km [-]

0.12

NDVI range @ 10km [-]

0.26

NDVI range @ 20km [-]

0.2


NDVI slope @ 1 km

0.000238447911442

NDVI slope @ 2 km

0.00027940104661

NDVI slope @ 5 km

0.000374733906012

NDVI slope @ 10 km

0.00041060860111

NDVI slope @ 20 km

0.000238493165081


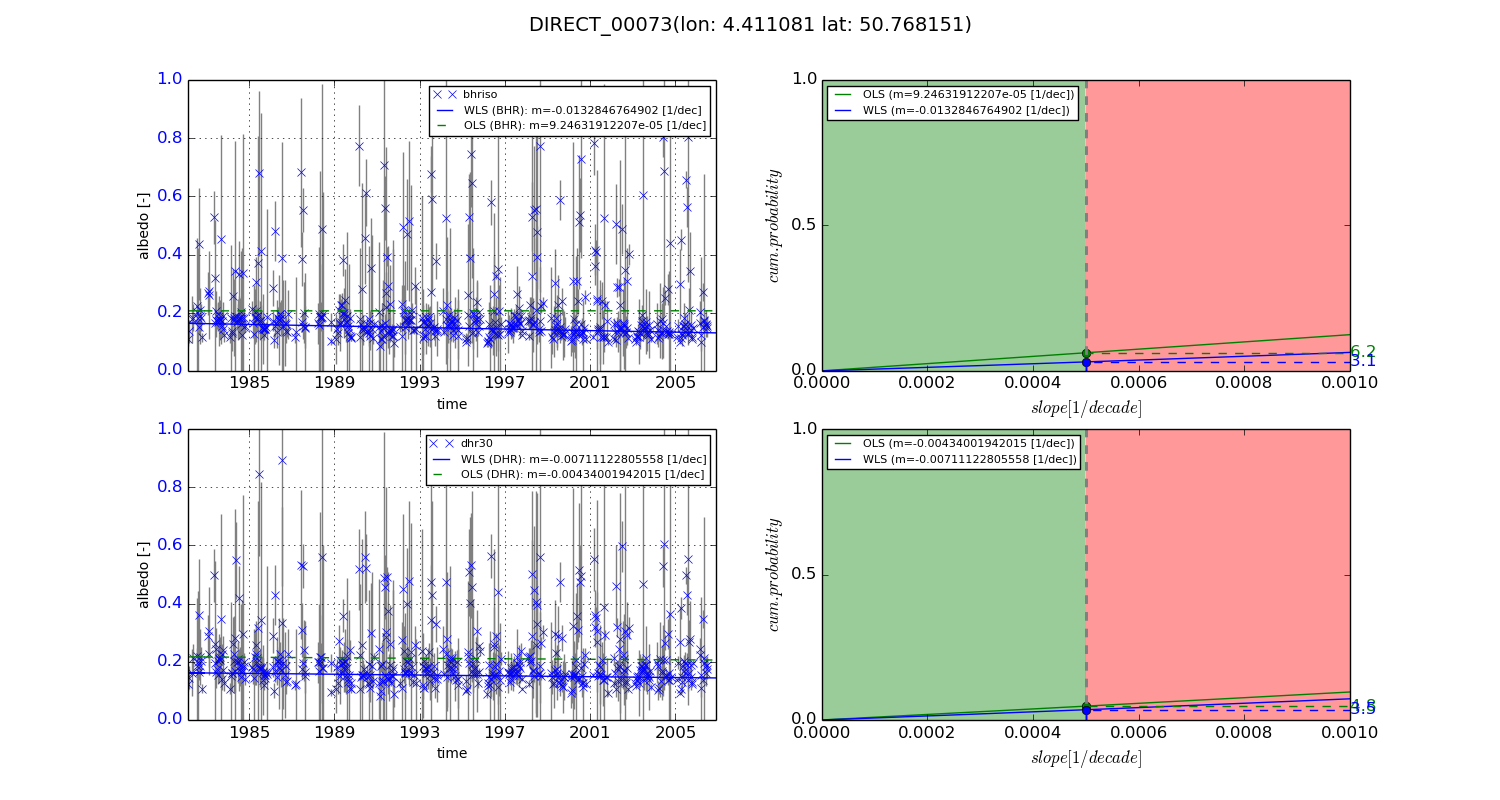
Temporal stability analysis

+000 deg (BHR)


BHR statistics

Temporal stability [1/decade]:


abs

rel


Weighted least square:

-0.0132846764902


Ordinary least square:

9.24631912207e-05


Probabilities that GCOS criteria is met:

Weighted least square:

3.1 %

Ordinary least square:

6.2 %


DHR statistics

Temporal stability [1/decade]:


abs

rel


Weighted least square:

-0.00711122805558


Ordinary least square:

-0.00434001942015


Probabilities that GCOS criteria is met:

Weighted least square:

3.5 %

Ordinary least square:

4.8 %


+057/+063 deg (BHR)


BHR statistics

Temporal stability [1/decade]:


abs

rel


Weighted least square:

-99999.0


Ordinary least square:

-99999.0


Probabilities that GCOS criteria is met:

Weighted least square:

-99999.0 %

Ordinary least square:

-99999.0 %


DHR statistics

Temporal stability [1/decade]:


abs

rel


Weighted least square:

-99999.0


Ordinary least square:

-99999.0


Probabilities that GCOS criteria is met:

Weighted least square:

-99999.0 %

Ordinary least square:

-99999.0 %


Temporal anomaly analyis

The variance of the temporal anomalies provides an additional measure about the stability of the signal AFTER removal of the mean seasonal cylce.
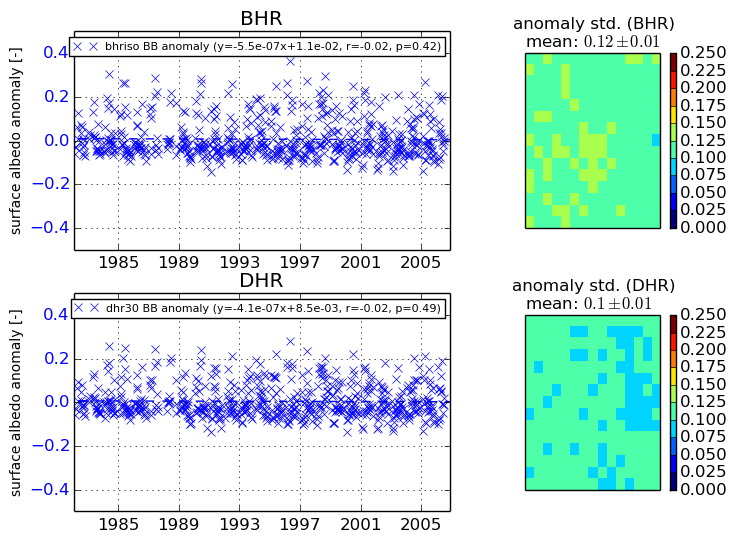
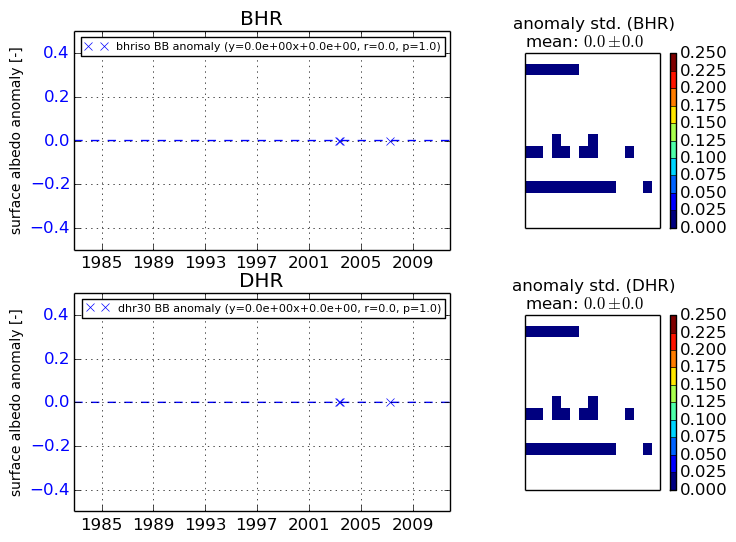
+000 deg


+057/+063 deg