DIRECT_00074


Location

lon / lat [deg]: 1.2375 / 43.5063

Source network: DIRECT


Geostationary surface albedo (GSA) data


“+000”


“+057/+063”


Landcover information (based on ESA CCI landcover data)


Landcover fractions @ 2km distance


Landcover fractions @ 20 km distance


Legend


Distance to open water bodies [km]:

4.43

Distance to urban areas [km]:

1.18


Radius: 1 km

Number of landcover classes:

1

Dominant landcover type:

10: cropland, rainfed

Fraction of dominant landcover type [%]:

100.0


Radius: 2 km

Number of landcover classes:

2

Dominant landcover type:

10: cropland, rainfed

Fraction of dominant landcover type [%]:

96.0


Radius: 5 km

Number of landcover classes:

2

Dominant landcover type:

10: cropland, rainfed

Fraction of dominant landcover type [%]:

85.0


Radius: 10 km

Number of landcover classes:

3

Dominant landcover type:

10: cropland, rainfed

Fraction of dominant landcover type [%]:

77.0


Radius: 20 km

Number of landcover classes:

5

Dominant landcover type:

10: cropland, rainfed

Fraction of dominant landcover type [%]:

74.0


Disturbances


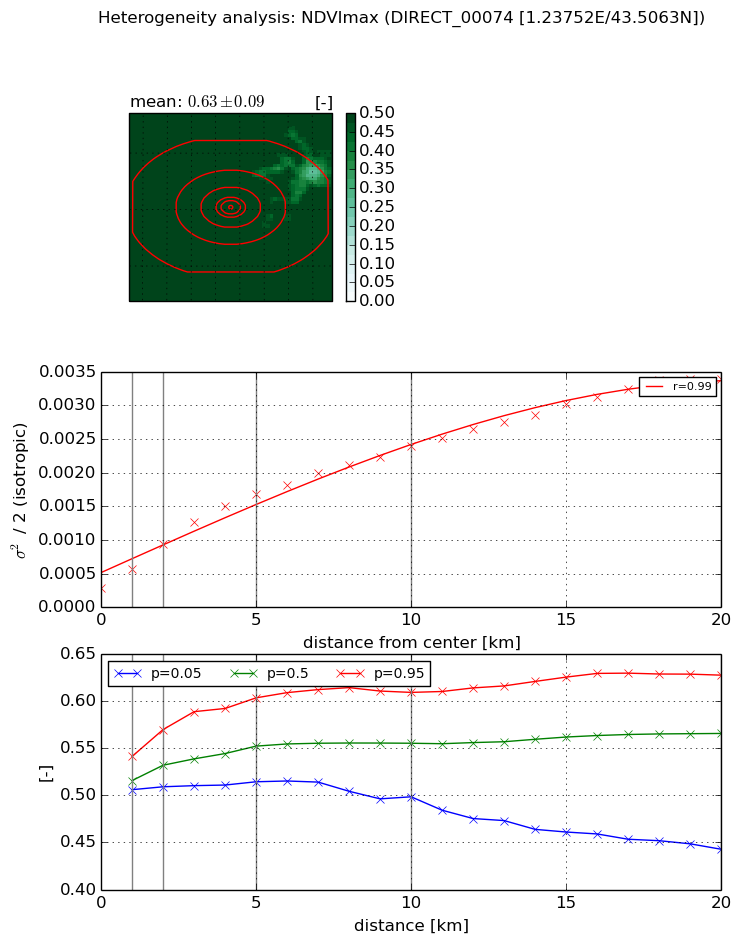
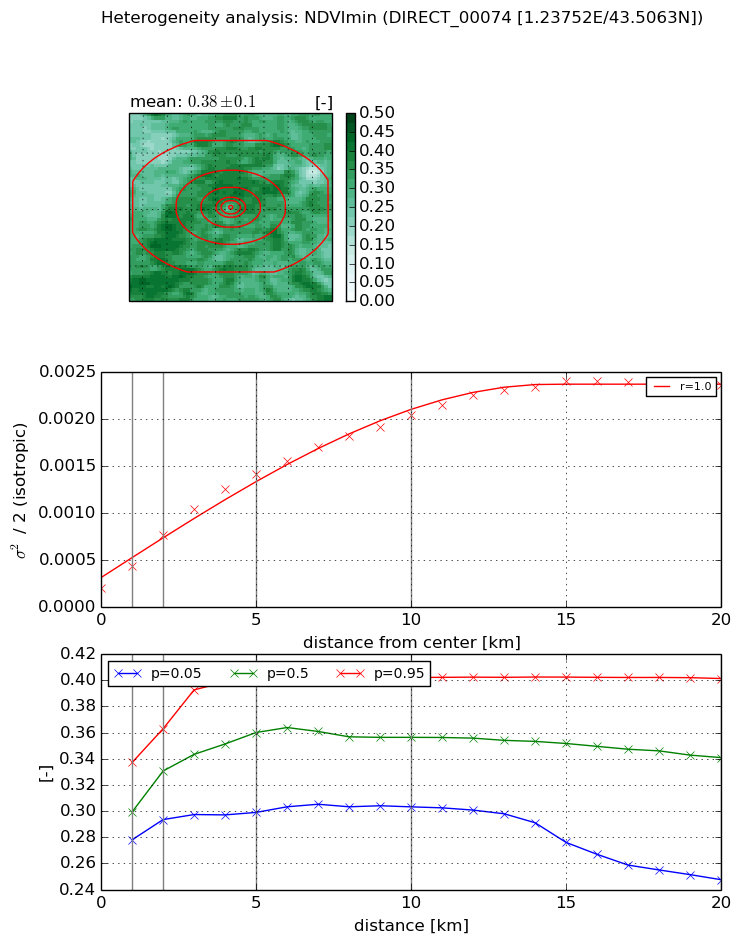
Heterogeneity analysis

The heterogeneity analysis provides information about the spatial and temporal heterogeneity of the site.

Topography


Roman et al. (2009) index


St

0.000619713337243

Rcv

0.325062371399

Rse

0.0

Rst

2.72177057889e-05

Rsv

4840.62284506


Height range @ 1km [m]

5

Height range @ 2km [m]

26

Height range @ 5km [m]

44

Height range @ 10km [m]

-999

Height range @ 20km [m]

-999


Variance slope @ 1 km

35

Variance slope @ 2 km

36

Variance slope @ 5 km

48

Variance slope @ 10 km

-999

Variance slope @ 20 km

-999


NDVI (max. NDVI composite)


Roman et al. (2009) index


St

4.31735425076

Rcv

0.0753162451824

Rse

0.0

Rst

-0.120272731798

Rsv

0.499281035011


NDVI range @ 1km [-]

0.04

NDVI range @ 2km [-]

0.06

NDVI range @ 5km [-]

0.09

NDVI range @ 10km [-]

0.11

NDVI range @ 20km [-]

0.18


Variance slope @ 1 km

0.000286393811722

Variance slope @ 2 km

0.000333277790484

Variance slope @ 5 km

0.000290090281844

Variance slope @ 10 km

0.000204707260016

Variance slope @ 20 km

0.000148144131888


NDVI (min. NDVI composite)I


Roman et al. (2009) index


St

2.49268704174

Rcv

0.0482066948163

Rse

0.0

Rst

-0.183548021892

Rsv

0.971765801416


NDVI range @ 1km [-]

0.06

NDVI range @ 2km [-]

0.07

NDVI range @ 5km [-]

0.11

NDVI range @ 10km [-]

0.1

NDVI range @ 20km [-]

0.15


NDVI slope @ 1 km

0.000235404828626

NDVI slope @ 2 km

0.000278372805198

NDVI slope @ 5 km

0.000250567260266

NDVI slope @ 10 km

0.000180420318433

NDVI slope @ 20 km

0.00010307816921


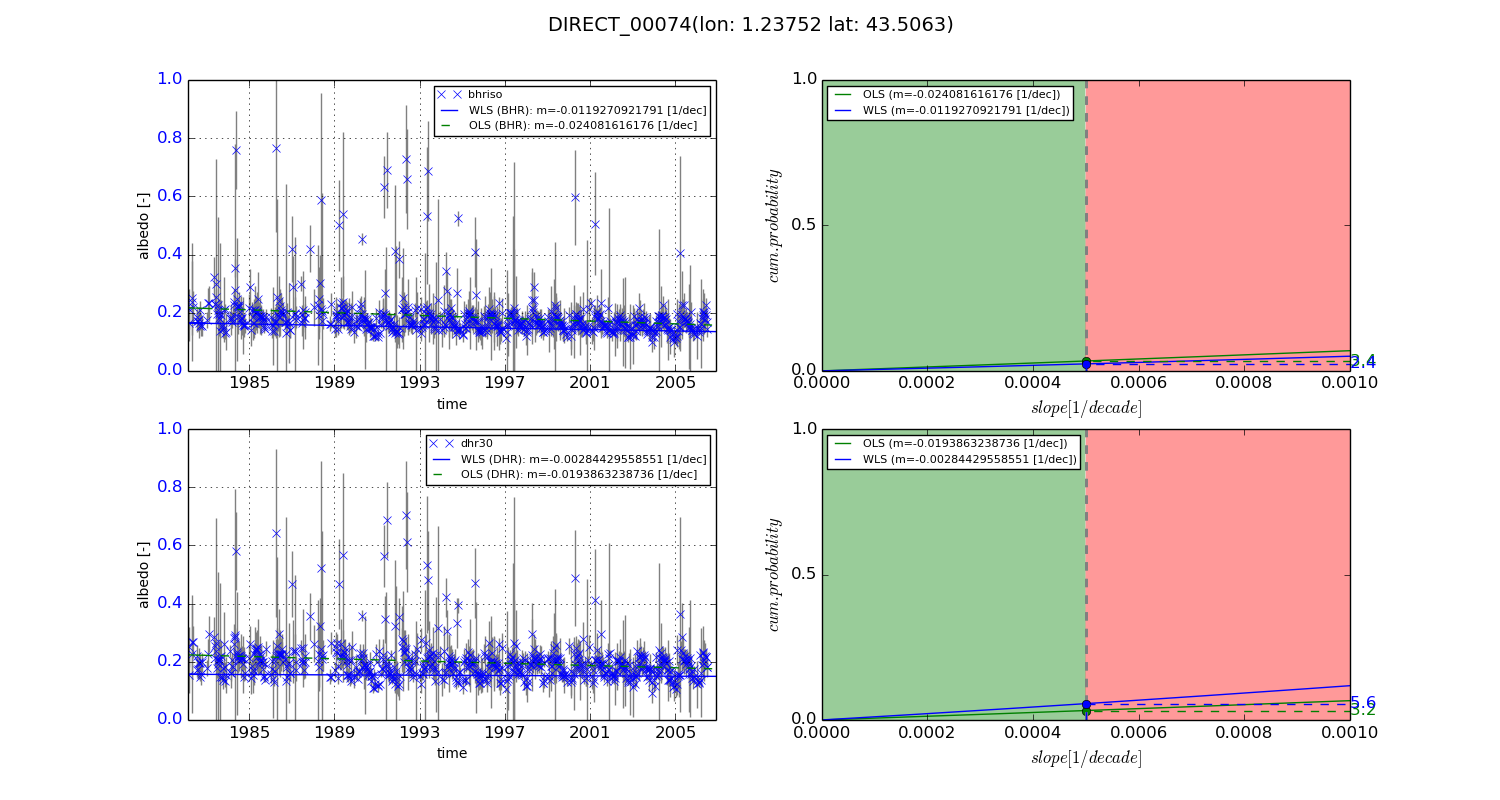
Temporal stability analysis

+000 deg (BHR)


BHR statistics

Temporal stability [1/decade]:


abs

rel


Weighted least square:

-0.0119270921791


Ordinary least square:

-0.024081616176


Probabilities that GCOS criteria is met:

Weighted least square:

2.4 %

Ordinary least square:

3.4 %


DHR statistics

Temporal stability [1/decade]:


abs

rel


Weighted least square:

-0.00284429558551


Ordinary least square:

-0.0193863238736


Probabilities that GCOS criteria is met:

Weighted least square:

5.6 %

Ordinary least square:

3.2 %


+057/+063 deg (BHR)


BHR statistics

Temporal stability [1/decade]:


abs

rel


Weighted least square:

-99999.0


Ordinary least square:

-99999.0


Probabilities that GCOS criteria is met:

Weighted least square:

-99999.0 %

Ordinary least square:

-99999.0 %


DHR statistics

Temporal stability [1/decade]:


abs

rel


Weighted least square:

-99999.0


Ordinary least square:

-99999.0


Probabilities that GCOS criteria is met:

Weighted least square:

-99999.0 %

Ordinary least square:

-99999.0 %


Temporal anomaly analyis

The variance of the temporal anomalies provides an additional measure about the stability of the signal AFTER removal of the mean seasonal cylce.
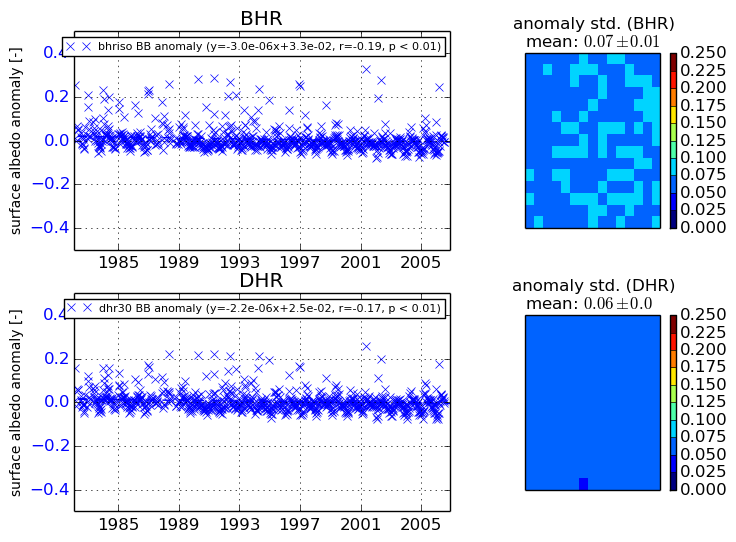
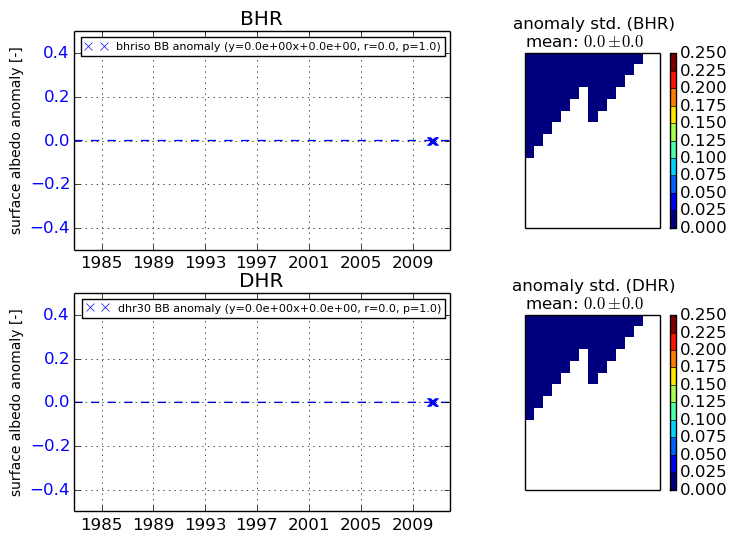
+000 deg


+057/+063 deg