DIRECT_00076


Location

lon / lat [deg]: -68.1933 / -18.2395

Source network: DIRECT


Geostationary surface albedo (GSA) data


“+000”


“+057/+063”


Landcover information (based on ESA CCI landcover data)


Landcover fractions @ 2km distance


Landcover fractions @ 20 km distance


Legend


Distance to open water bodies [km]:

18.8

Distance to urban areas [km]:

64.46


Radius: 1 km

Number of landcover classes:

1

Dominant landcover type:

200: bare areas

Fraction of dominant landcover type [%]:

100.0


Radius: 2 km

Number of landcover classes:

1

Dominant landcover type:

200: bare areas

Fraction of dominant landcover type [%]:

100.0


Radius: 5 km

Number of landcover classes:

1

Dominant landcover type:

200: bare areas

Fraction of dominant landcover type [%]:

99.0


Radius: 10 km

Number of landcover classes:

4

Dominant landcover type:

200: bare areas

Fraction of dominant landcover type [%]:

90.0


Radius: 20 km

Number of landcover classes:

5

Dominant landcover type:

200: bare areas

Fraction of dominant landcover type [%]:

69.0


Disturbances


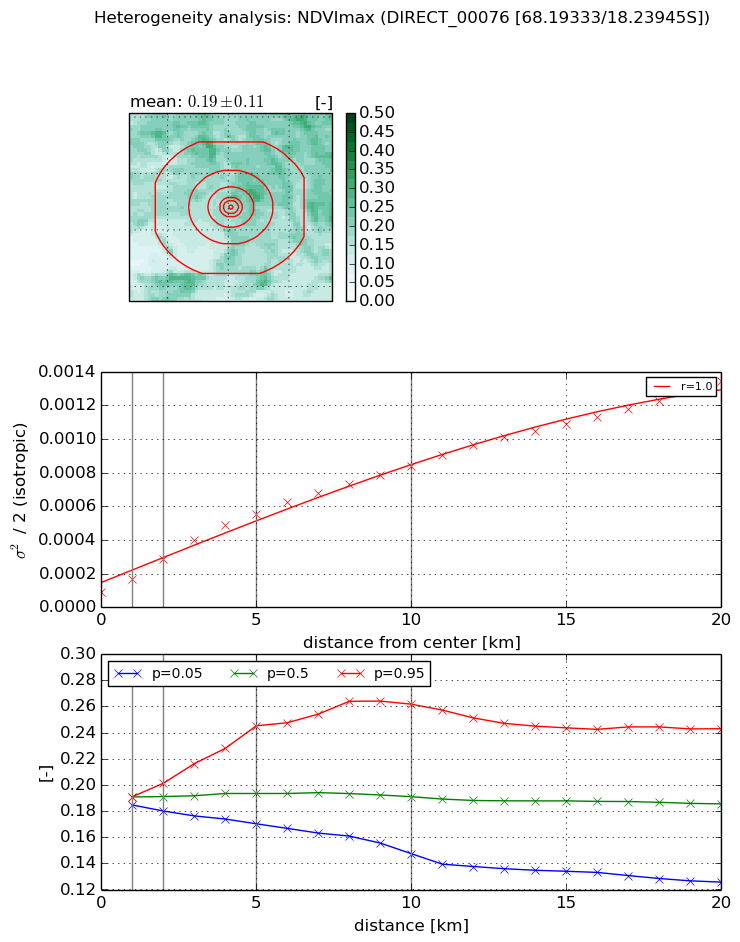
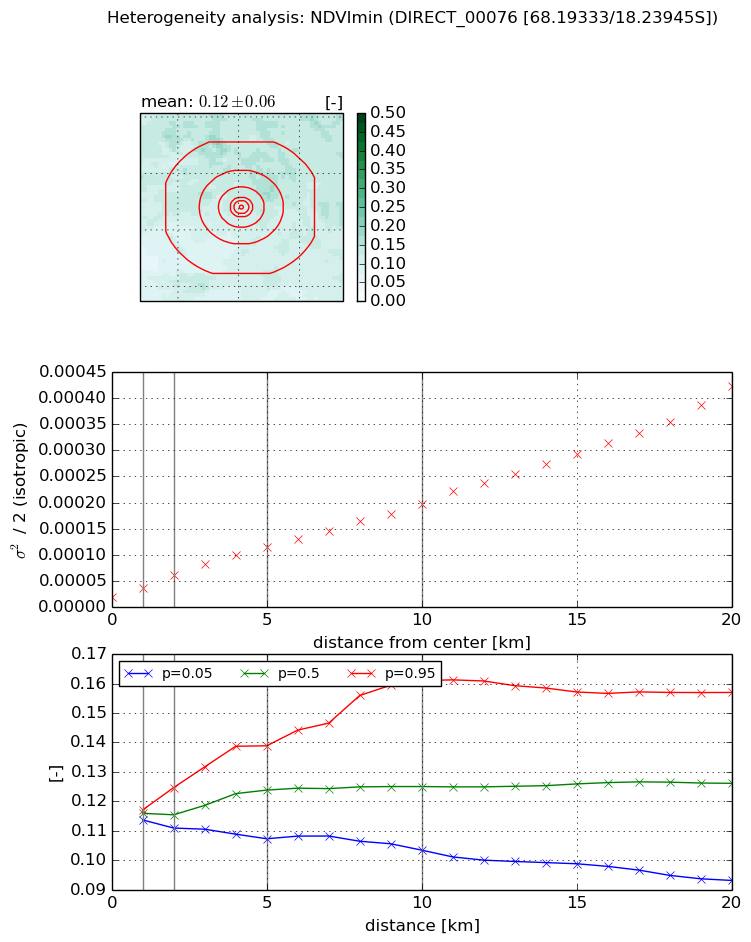
Heterogeneity analysis

The heterogeneity analysis provides information about the spatial and temporal heterogeneity of the site.

Topography


Roman et al. (2009) index


St

0.000946512192599

Rcv

3.9482849641

Rse

0.0

Rst

0.00100836909011

Rsv

3165.58198525


Height range @ 1km [m]

8

Height range @ 2km [m]

13

Height range @ 5km [m]

88

Height range @ 10km [m]

-999

Height range @ 20km [m]

-999


Variance slope @ 1 km

453

Variance slope @ 2 km

587

Variance slope @ 5 km

558

Variance slope @ 10 km

-999

Variance slope @ 20 km

-999


NDVI (max. NDVI composite)


Roman et al. (2009) index


St

1.51649539291

Rcv

0.694425699734

Rse

0.0

Rst

-0.28382025321

Rsv

-0.999999423886


NDVI range @ 1km [-]

0.01

NDVI range @ 2km [-]

0.02

NDVI range @ 5km [-]

0.07

NDVI range @ 10km [-]

0.11

NDVI range @ 20km [-]

0.12


Variance slope @ 1 km

7.62411104977e-05

Variance slope @ 2 km

9.76885162009e-05

Variance slope @ 5 km

9.64928704021e-05

Variance slope @ 10 km

7.48162805951e-05

Variance slope @ 20 km

5.88082212956e-05


NDVI (min. NDVI composite)I


Roman et al. (2009) index


St

1.81809273835

Rcv

0.47888361617

Rse

0.0

Rst

-0.247673835887

Rsv

0.923523391849


NDVI range @ 1km [-]

0.0

NDVI range @ 2km [-]

0.01

NDVI range @ 5km [-]

0.03

NDVI range @ 10km [-]

0.06

NDVI range @ 20km [-]

0.06


NDVI slope @ 1 km

1.63553066273e-05

NDVI slope @ 2 km

2.06761069268e-05

NDVI slope @ 5 km

1.95404133427e-05

NDVI slope @ 10 km

1.74570113532e-05

NDVI slope @ 20 km

1.88496340556e-05


Temporal stability analysis

+000 deg (BHR)


BHR statistics

Temporal stability [1/decade]:


abs

rel


Weighted least square:

-99999.0


Ordinary least square:

-99999.0


Probabilities that GCOS criteria is met:

Weighted least square:

-99999.0 %

Ordinary least square:

-99999.0 %


DHR statistics

Temporal stability [1/decade]:


abs

rel


Weighted least square:

-99999.0


Ordinary least square:

-99999.0


Probabilities that GCOS criteria is met:

Weighted least square:

-99999.0 %

Ordinary least square:

-99999.0 %


+057/+063 deg (BHR)


BHR statistics

Temporal stability [1/decade]:


abs

rel


Weighted least square:

None


Ordinary least square:

None


Probabilities that GCOS criteria is met:

Weighted least square:

None %

Ordinary least square:

None %


DHR statistics

Temporal stability [1/decade]:


abs

rel


Weighted least square:

None


Ordinary least square:

None


Probabilities that GCOS criteria is met:

Weighted least square:

None %

Ordinary least square:

None %


Temporal anomaly analyis

The variance of the temporal anomalies provides an additional measure about the stability of the signal AFTER removal of the mean seasonal cylce.

+000 deg


+057/+063 deg