DIRECT_00077


Location

lon / lat [deg]: 2.6353 / 13.645

Source network: DIRECT


Geostationary surface albedo (GSA) data


“+000”


“+057/+063”


Landcover information (based on ESA CCI landcover data)


Landcover fractions @ 2km distance


Landcover fractions @ 20 km distance


Legend


Distance to open water bodies [km]:

42.77

Distance to urban areas [km]:

23.92


Radius: 1 km

Number of landcover classes:

3

Dominant landcover type:

10: cropland, rainfed

Fraction of dominant landcover type [%]:

83.0


Radius: 2 km

Number of landcover classes:

3

Dominant landcover type:

10: cropland, rainfed

Fraction of dominant landcover type [%]:

73.0


Radius: 5 km

Number of landcover classes:

3

Dominant landcover type:

10: cropland, rainfed

Fraction of dominant landcover type [%]:

76.0


Radius: 10 km

Number of landcover classes:

4

Dominant landcover type:

10: cropland, rainfed

Fraction of dominant landcover type [%]:

63.0


Radius: 20 km

Number of landcover classes:

5

Dominant landcover type:

10: cropland, rainfed

Fraction of dominant landcover type [%]:

57.0


Disturbances


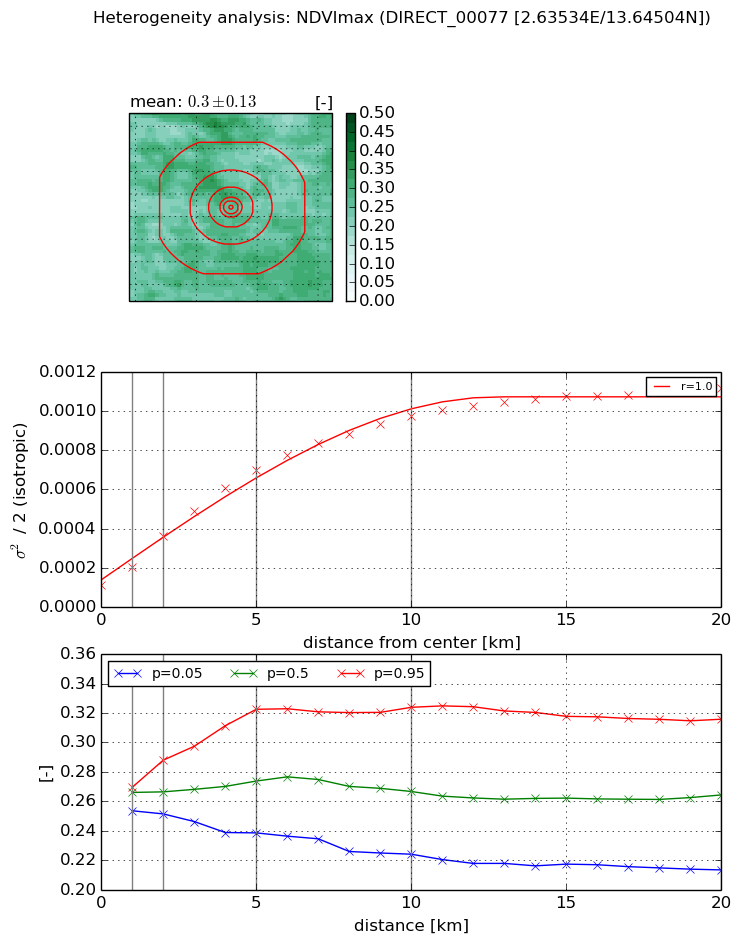
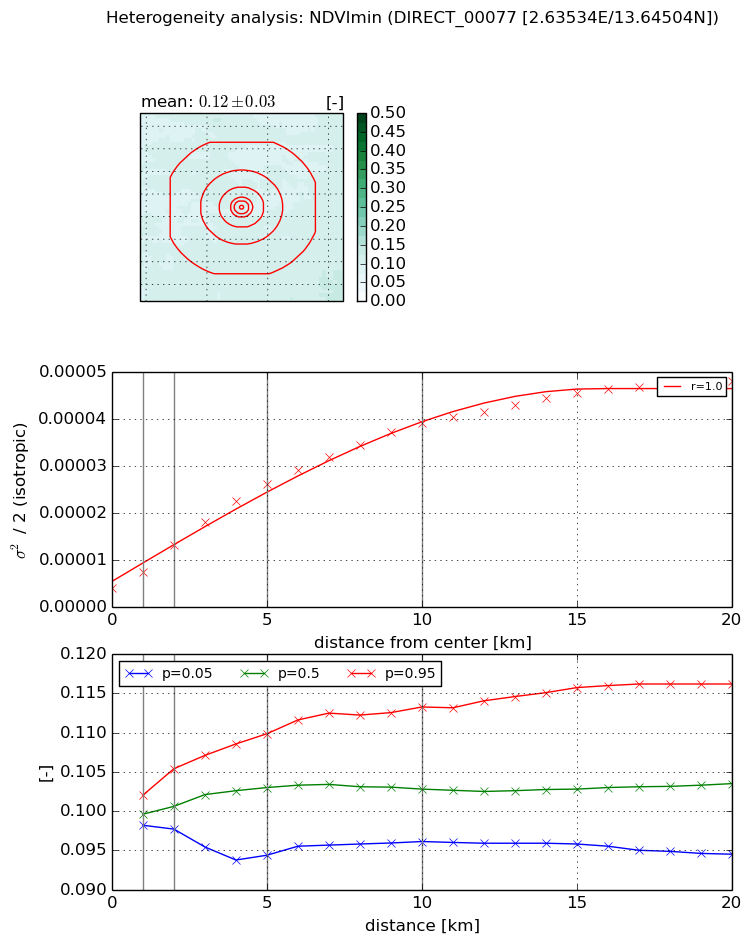
Heterogeneity analysis

The heterogeneity analysis provides information about the spatial and temporal heterogeneity of the site.

Topography


Roman et al. (2009) index


St

9.80805464864

Rcv

-0.143736961859

Rse

0.0

Rst

-0.122941311338

Rsv

-0.0391927794704


Height range @ 1km [m]

26

Height range @ 2km [m]

49

Height range @ 5km [m]

48

Height range @ 10km [m]

-999

Height range @ 20km [m]

-999


Variance slope @ 1 km

54

Variance slope @ 2 km

67

Variance slope @ 5 km

50

Variance slope @ 10 km

-999

Variance slope @ 20 km

-999


NDVI (max. NDVI composite)


Roman et al. (2009) index


St

1.7303381984

Rcv

0.405971993767

Rse

0.0

Rst

-0.377498532904

Rsv

0.950294585133


NDVI range @ 1km [-]

0.02

NDVI range @ 2km [-]

0.04

NDVI range @ 5km [-]

0.08

NDVI range @ 10km [-]

0.1

NDVI range @ 20km [-]

0.1


Variance slope @ 1 km

9.53883061571e-05

Variance slope @ 2 km

0.000124961025634

Variance slope @ 5 km

0.000121946062394

Variance slope @ 10 km

8.77653427394e-05

Variance slope @ 20 km

4.55036586838e-05


NDVI (min. NDVI composite)I


Roman et al. (2009) index


St

0.0293373985174

Rcv

0.304165237077

Rse

0.0

Rst

-5.28923065784e-07

Rsv

101.954389921


NDVI range @ 1km [-]

0.0

NDVI range @ 2km [-]

0.01

NDVI range @ 5km [-]

0.02

NDVI range @ 10km [-]

0.02

NDVI range @ 20km [-]

0.02


NDVI slope @ 1 km

3.47295584954e-06

NDVI slope @ 2 km

4.62683493928e-06

NDVI slope @ 5 km

4.60666366941e-06

NDVI slope @ 10 km

3.57179661219e-06

NDVI slope @ 20 km

2.11219094589e-06


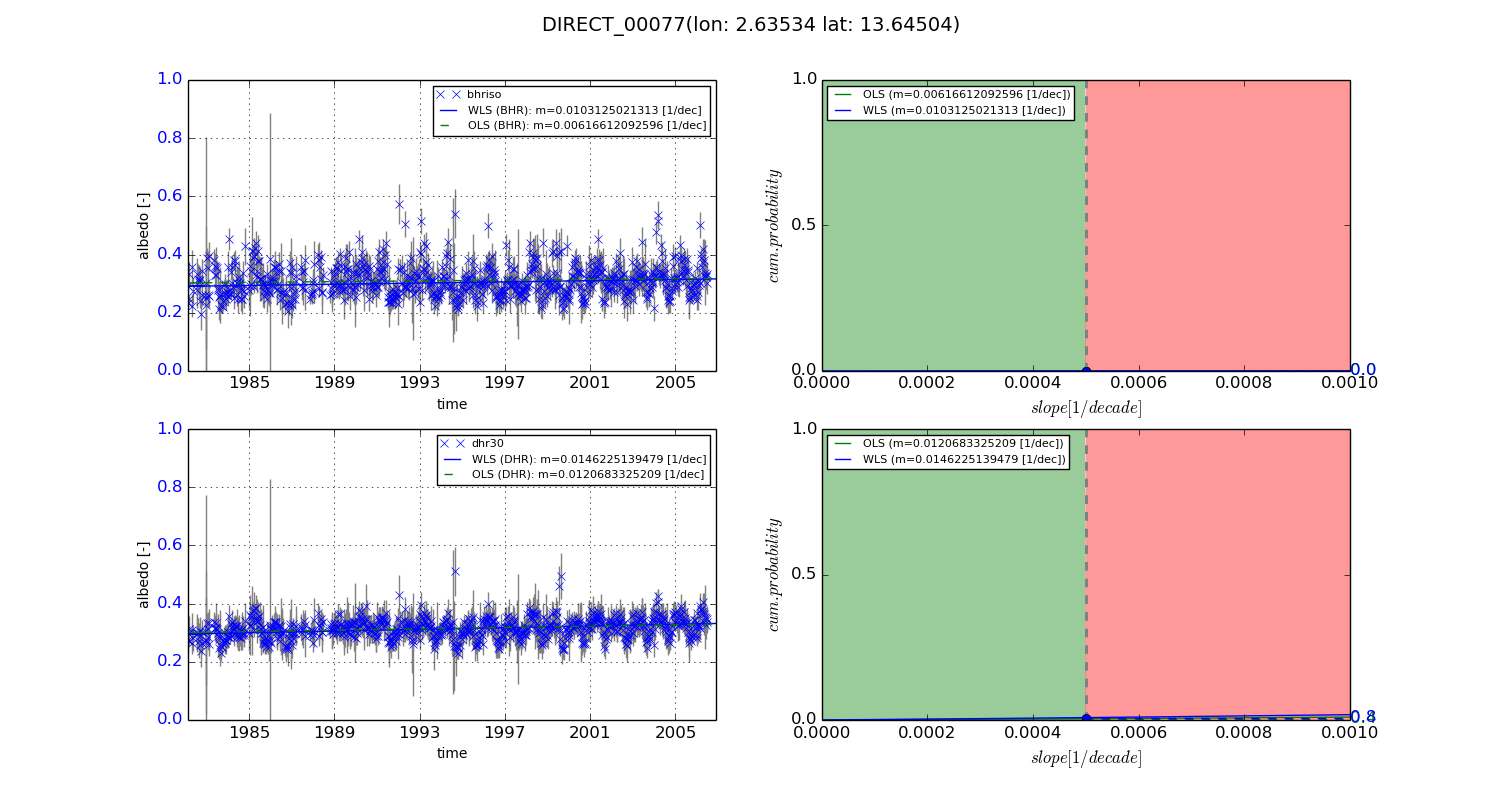
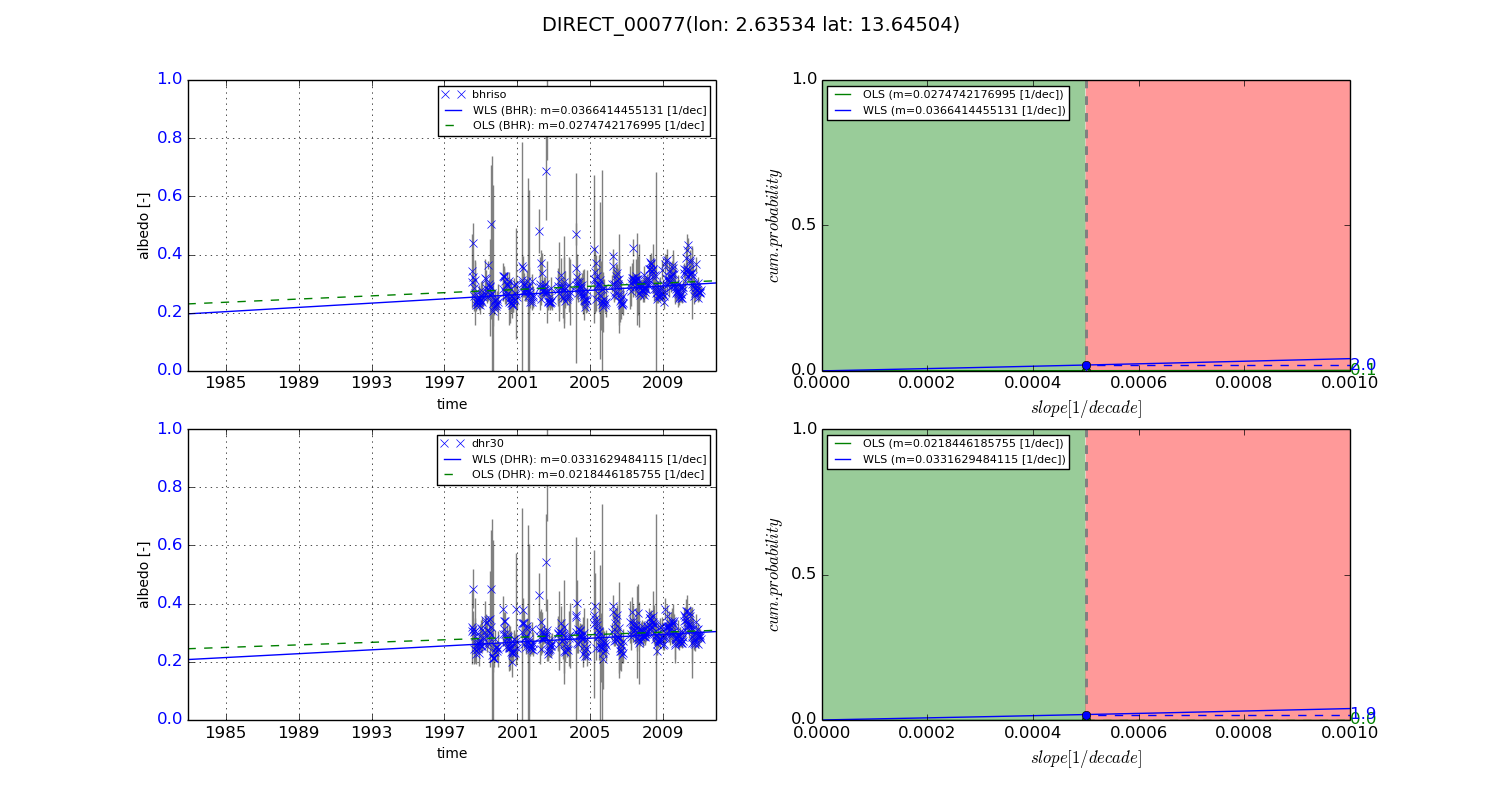
Temporal stability analysis

+000 deg (BHR)


BHR statistics

Temporal stability [1/decade]:


abs

rel


Weighted least square:

0.0103125021313


Ordinary least square:

0.00616612092596


Probabilities that GCOS criteria is met:

Weighted least square:

0.0 %

Ordinary least square:

0.0 %


DHR statistics

Temporal stability [1/decade]:


abs

rel


Weighted least square:

0.0146225139479


Ordinary least square:

0.0120683325209


Probabilities that GCOS criteria is met:

Weighted least square:

0.8 %

Ordinary least square:

0.4 %


+057/+063 deg (BHR)


BHR statistics

Temporal stability [1/decade]:


abs

rel


Weighted least square:

0.0366414455131


Ordinary least square:

0.0274742176995


Probabilities that GCOS criteria is met:

Weighted least square:

2.0 %

Ordinary least square:

0.1 %


DHR statistics

Temporal stability [1/decade]:


abs

rel


Weighted least square:

0.0331629484115


Ordinary least square:

0.0218446185755


Probabilities that GCOS criteria is met:

Weighted least square:

1.9 %

Ordinary least square:

0.0 %


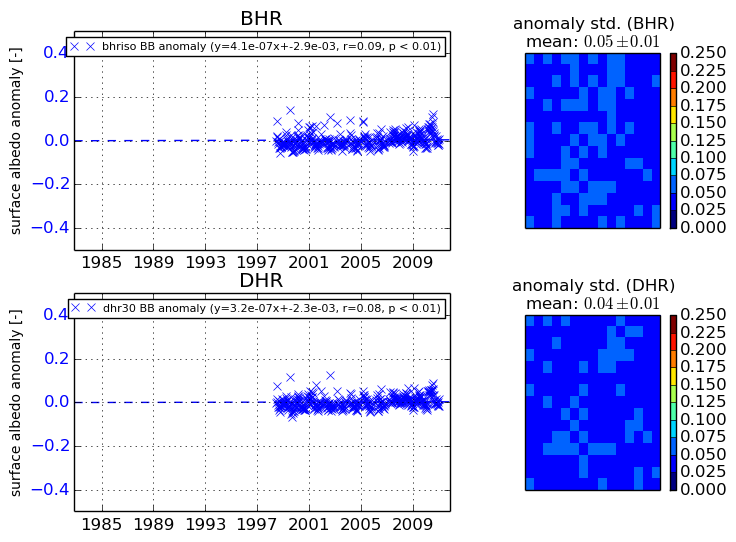
Temporal anomaly analyis

The variance of the temporal anomalies provides an additional measure about the stability of the signal AFTER removal of the mean seasonal cylce.
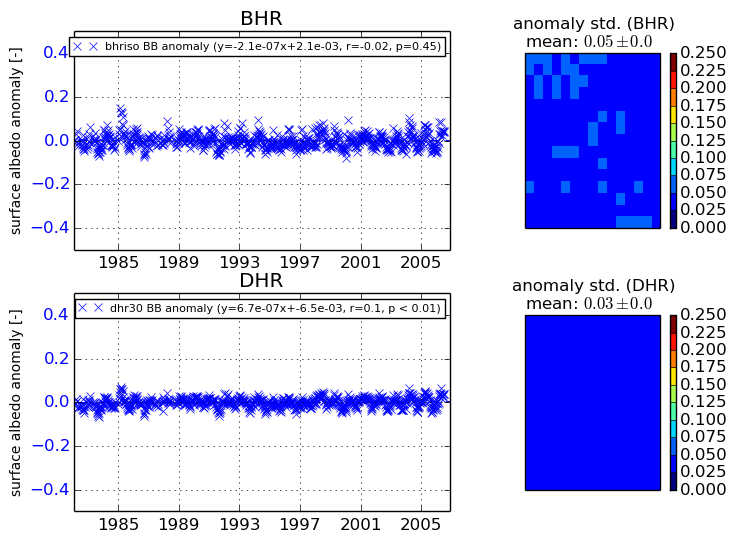
+000 deg


+057/+063 deg