DIRECT_00083


Location

lon / lat [deg]: 23.5908 / -19.9217

Source network: DIRECT


Geostationary surface albedo (GSA) data


“+000”


“+057/+063”


Landcover information (based on ESA CCI landcover data)


Landcover fractions @ 2km distance


Landcover fractions @ 20 km distance


Legend


Distance to open water bodies [km]:

44.21

Distance to urban areas [km]:

16.76


Radius: 1 km

Number of landcover classes:

3

Dominant landcover type:

10: cropland, rainfed

Fraction of dominant landcover type [%]:

89.0


Radius: 2 km

Number of landcover classes:

5

Dominant landcover type:

10: cropland, rainfed

Fraction of dominant landcover type [%]:

73.0


Radius: 5 km

Number of landcover classes:

5

Dominant landcover type:

10: cropland, rainfed

Fraction of dominant landcover type [%]:

75.0


Radius: 10 km

Number of landcover classes:

6

Dominant landcover type:

10: cropland, rainfed

Fraction of dominant landcover type [%]:

61.0


Radius: 20 km

Number of landcover classes:

5

Dominant landcover type:

10: cropland, rainfed

Fraction of dominant landcover type [%]:

40.0


Disturbances


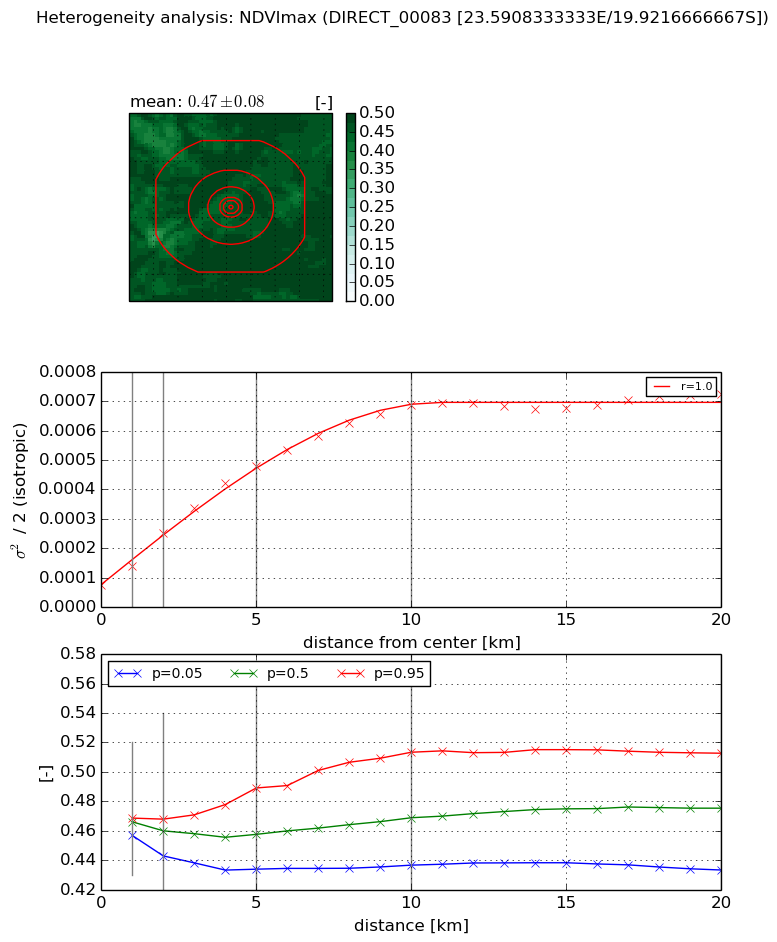
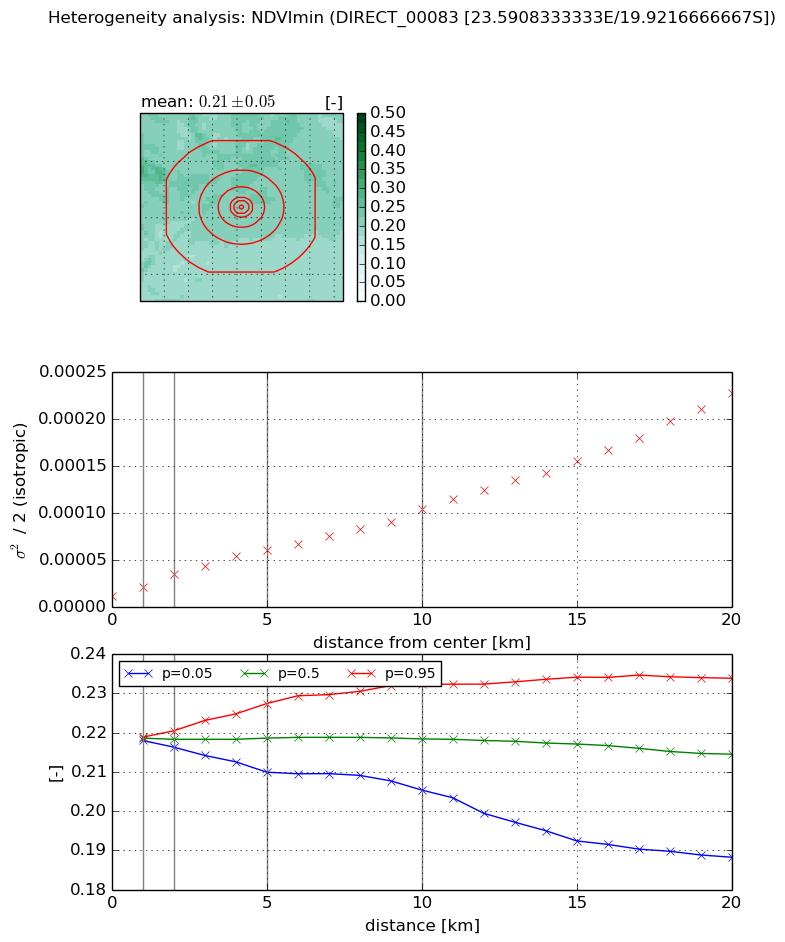
Heterogeneity analysis

The heterogeneity analysis provides information about the spatial and temporal heterogeneity of the site.

Topography


Roman et al. (2009) index


St

0.400166688546

Rcv

0.116520009299

Rse

0.0

Rst

0.481913316286

Rsv

6.89844256605


Height range @ 1km [m]

4

Height range @ 2km [m]

5

Height range @ 5km [m]

5

Height range @ 10km [m]

-999

Height range @ 20km [m]

-999


Variance slope @ 1 km

1

Variance slope @ 2 km

0

Variance slope @ 5 km

0

Variance slope @ 10 km

-999

Variance slope @ 20 km

-999


NDVI (max. NDVI composite)


Roman et al. (2009) index


St

1.94340307823

Rcv

0.613492420715

Rse

0.0

Rst

-0.0513565173442

Rsv

0.878834939775


NDVI range @ 1km [-]

0.01

NDVI range @ 2km [-]

0.03

NDVI range @ 5km [-]

0.06

NDVI range @ 10km [-]

0.08

NDVI range @ 20km [-]

0.08


Variance slope @ 1 km

6.3986634673e-05

Variance slope @ 2 km

8.87830476251e-05

Variance slope @ 5 km

8.42629669004e-05

Variance slope @ 10 km

6.22036607432e-05

Variance slope @ 20 km

2.80785818601e-05


NDVI (min. NDVI composite)I


Roman et al. (2009) index


St

1.14072075907

Rcv

0.838012351771

Rse

0.0

Rst

-3.41439757321e-09

Rsv

1.79190384135


NDVI range @ 1km [-]

0.0

NDVI range @ 2km [-]

0.0

NDVI range @ 5km [-]

0.02

NDVI range @ 10km [-]

0.03

NDVI range @ 20km [-]

0.05


NDVI slope @ 1 km

9.29459786444e-06

NDVI slope @ 2 km

1.14775995383e-05

NDVI slope @ 5 km

9.92931475607e-06

NDVI slope @ 10 km

8.74818689037e-06

NDVI slope @ 20 km

1.01887782891e-05


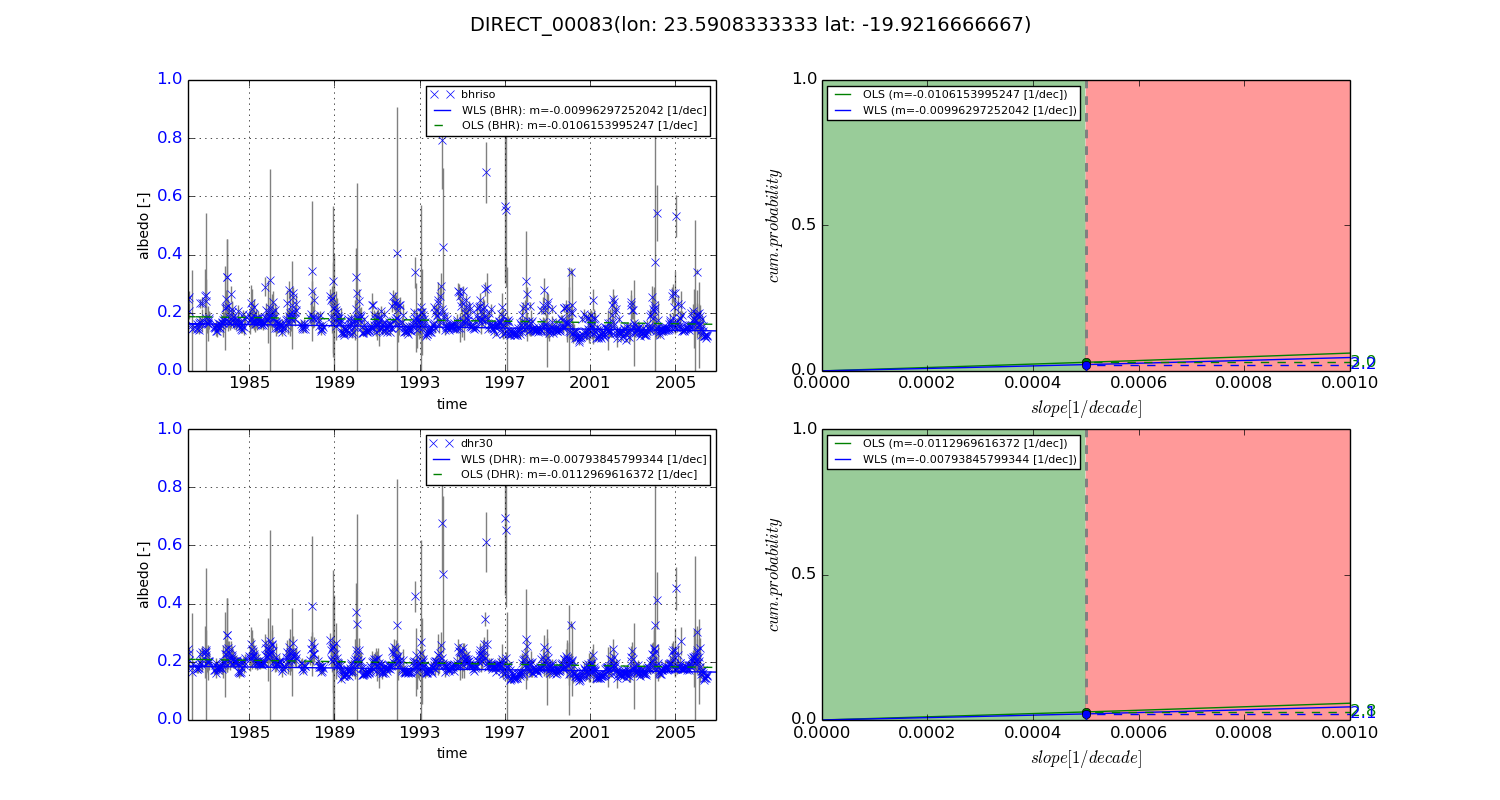
Temporal stability analysis

+000 deg (BHR)


BHR statistics

Temporal stability [1/decade]:


abs

rel


Weighted least square:

-0.00996297252042


Ordinary least square:

-0.0106153995247


Probabilities that GCOS criteria is met:

Weighted least square:

2.2 %

Ordinary least square:

3.0 %


DHR statistics

Temporal stability [1/decade]:


abs

rel


Weighted least square:

-0.00793845799344


Ordinary least square:

-0.0112969616372


Probabilities that GCOS criteria is met:

Weighted least square:

2.1 %

Ordinary least square:

2.8 %


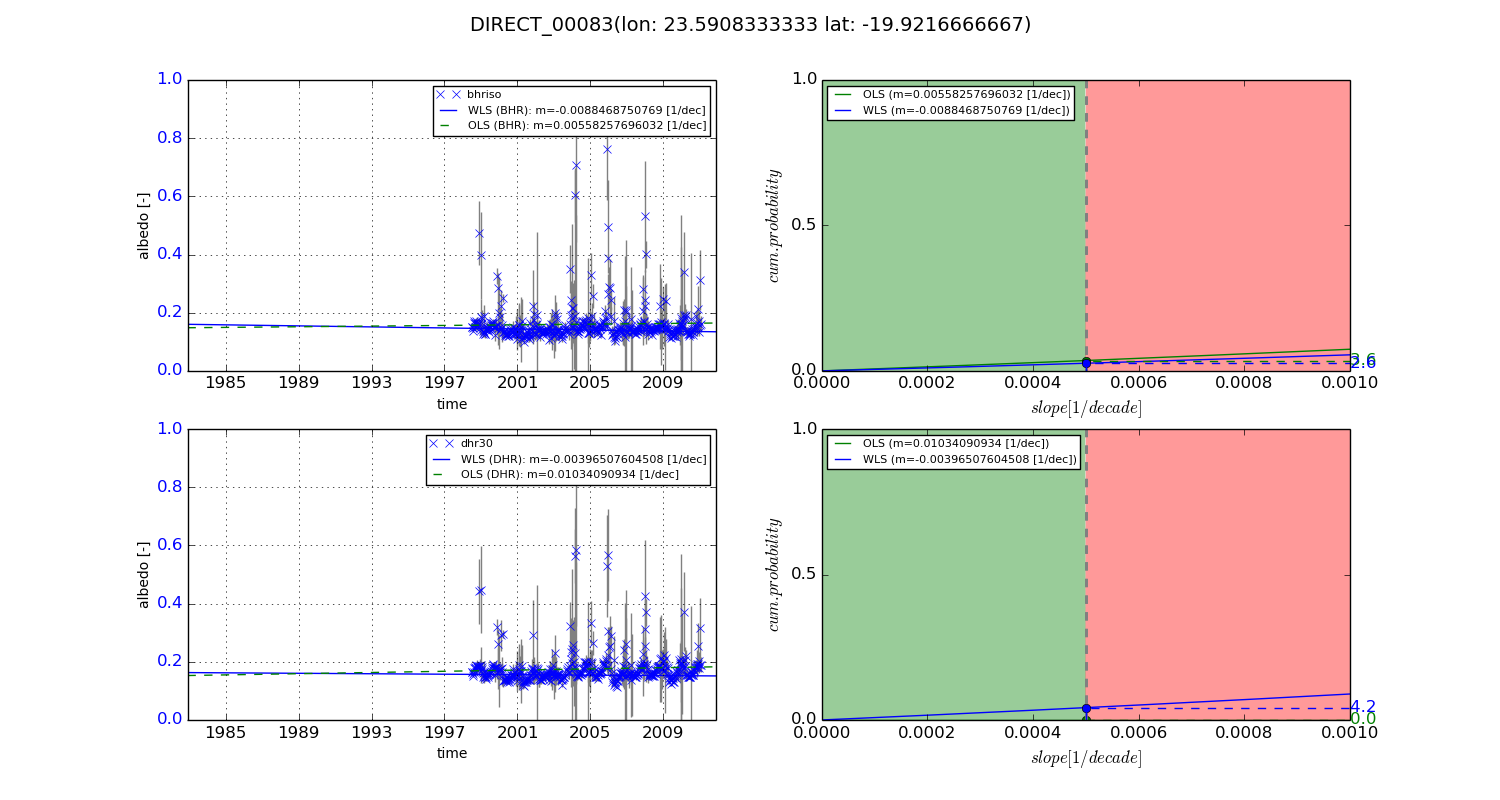
+057/+063 deg (BHR)


BHR statistics

Temporal stability [1/decade]:


abs

rel


Weighted least square:

-0.0088468750769


Ordinary least square:

0.00558257696032


Probabilities that GCOS criteria is met:

Weighted least square:

2.6 %

Ordinary least square:

3.6 %


DHR statistics

Temporal stability [1/decade]:


abs

rel


Weighted least square:

-0.00396507604508


Ordinary least square:

0.01034090934


Probabilities that GCOS criteria is met:

Weighted least square:

4.2 %

Ordinary least square:

0.0 %


Temporal anomaly analyis

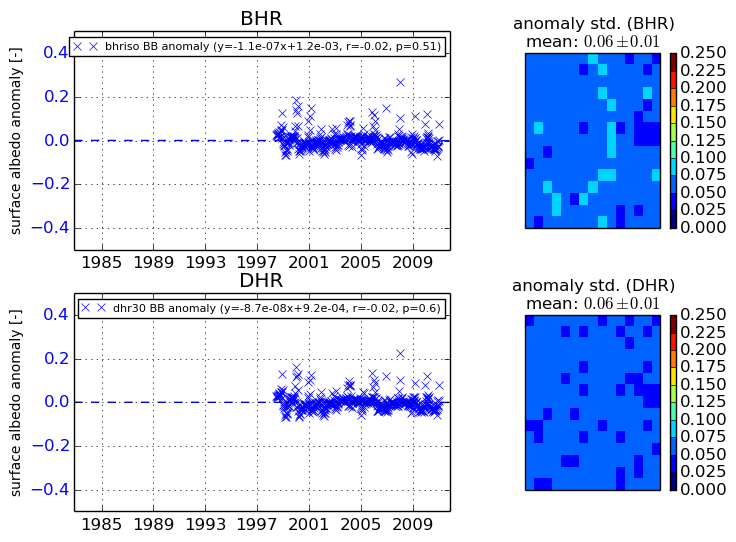
The variance of the temporal anomalies provides an additional measure about the stability of the signal AFTER removal of the mean seasonal cylce.
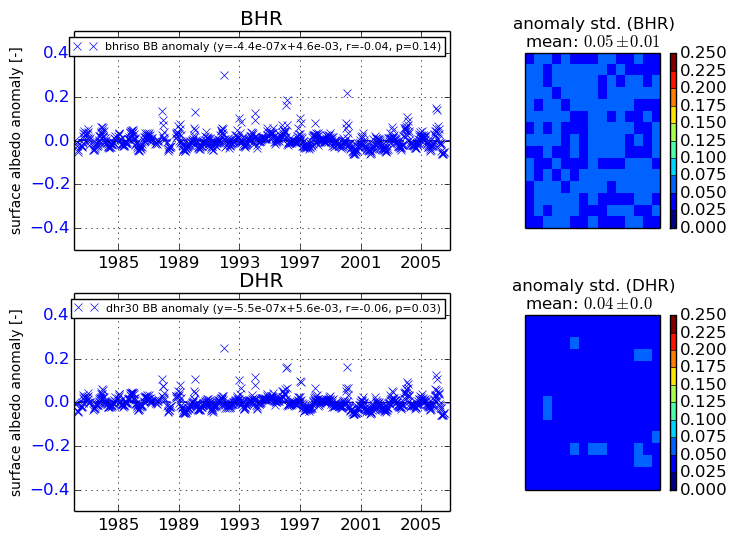
+000 deg


+057/+063 deg