DIRECT_00087


Location

lon / lat [deg]: -15.4034 / 15.4316

Source network: DIRECT


Geostationary surface albedo (GSA) data


“+000”


“+057/+063”


Landcover information (based on ESA CCI landcover data)


Landcover fractions @ 2km distance


Landcover fractions @ 20 km distance


Legend


Distance to open water bodies [km]:

29.05

Distance to urban areas [km]:

11.51


Radius: 1 km

Number of landcover classes:

3

Dominant landcover type:

100: Mosaic tree and shrub (>50%) / herbaceous cover (<50%)

Fraction of dominant landcover type [%]:

80.0


Radius: 2 km

Number of landcover classes:

3

Dominant landcover type:

100: Mosaic tree and shrub (>50%) / herbaceous cover (<50%)

Fraction of dominant landcover type [%]:

88.0


Radius: 5 km

Number of landcover classes:

3

Dominant landcover type:

100: Mosaic tree and shrub (>50%) / herbaceous cover (<50%)

Fraction of dominant landcover type [%]:

78.0


Radius: 10 km

Number of landcover classes:

3

Dominant landcover type:

100: Mosaic tree and shrub (>50%) / herbaceous cover (<50%)

Fraction of dominant landcover type [%]:

72.0


Radius: 20 km

Number of landcover classes:

4

Dominant landcover type:

100: Mosaic tree and shrub (>50%) / herbaceous cover (<50%)

Fraction of dominant landcover type [%]:

56.0


Disturbances


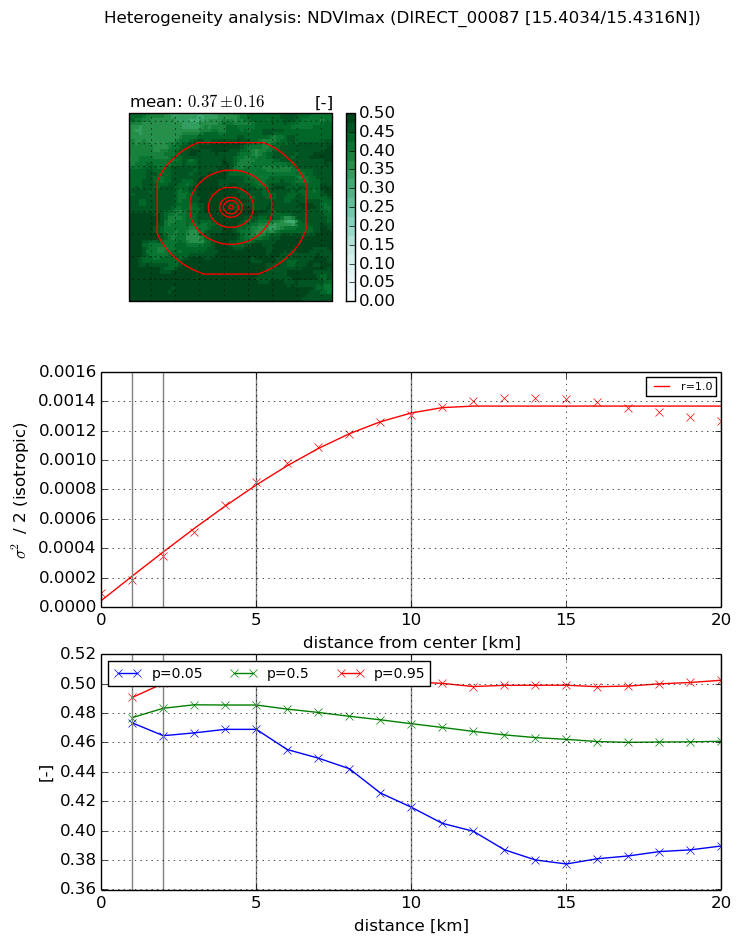
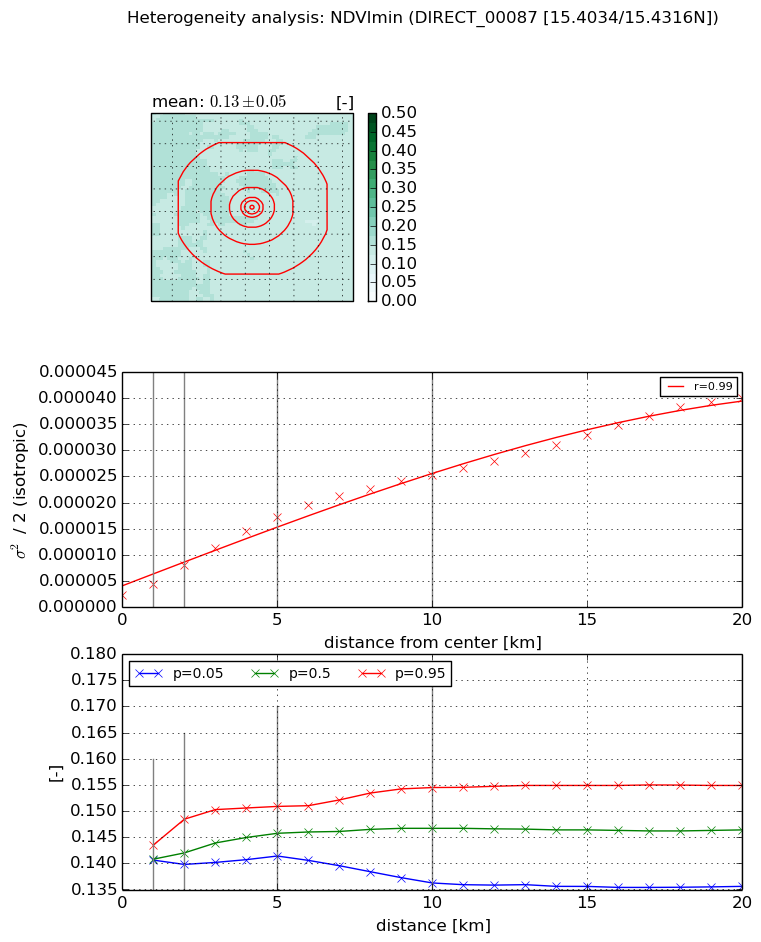
Heterogeneity analysis

The heterogeneity analysis provides information about the spatial and temporal heterogeneity of the site.

Topography


Roman et al. (2009) index


St

2.74228156058

Rcv

0.192348766962

Rse

0.0

Rst

-0.0517837248696

Rsv

0.849847077272


Height range @ 1km [m]

5

Height range @ 2km [m]

7

Height range @ 5km [m]

9

Height range @ 10km [m]

-999

Height range @ 20km [m]

-999


Variance slope @ 1 km

2

Variance slope @ 2 km

2

Variance slope @ 5 km

1

Variance slope @ 10 km

-999

Variance slope @ 20 km

-999


NDVI (max. NDVI composite)


Roman et al. (2009) index


St

0.204049050621

Rcv

-0.0274638542223

Rse

0.0

Rst

2.70732289301e-08

Rsv

14.6748833772


NDVI range @ 1km [-]

0.02

NDVI range @ 2km [-]

0.04

NDVI range @ 5km [-]

0.04

NDVI range @ 10km [-]

0.09

NDVI range @ 20km [-]

0.11


Variance slope @ 1 km

8.96339557723e-05

Variance slope @ 2 km

0.00012654546828

Variance slope @ 5 km

0.000156203996802

Variance slope @ 10 km

0.000129980258513

Variance slope @ 20 km

5.96296155072e-05


NDVI (min. NDVI composite)I


Roman et al. (2009) index


St

10.6859752572

Rcv

-0.0843294046157

Rse

0.0

Rst

0.06865169825

Rsv

-0.127760703828


NDVI range @ 1km [-]

0.0

NDVI range @ 2km [-]

0.01

NDVI range @ 5km [-]

0.01

NDVI range @ 10km [-]

0.02

NDVI range @ 20km [-]

0.02


NDVI slope @ 1 km

2.09814136302e-06

NDVI slope @ 2 km

2.82555082018e-06

NDVI slope @ 5 km

3.09551053476e-06

NDVI slope @ 10 km

2.37964600167e-06

NDVI slope @ 20 km

1.81027270643e-06


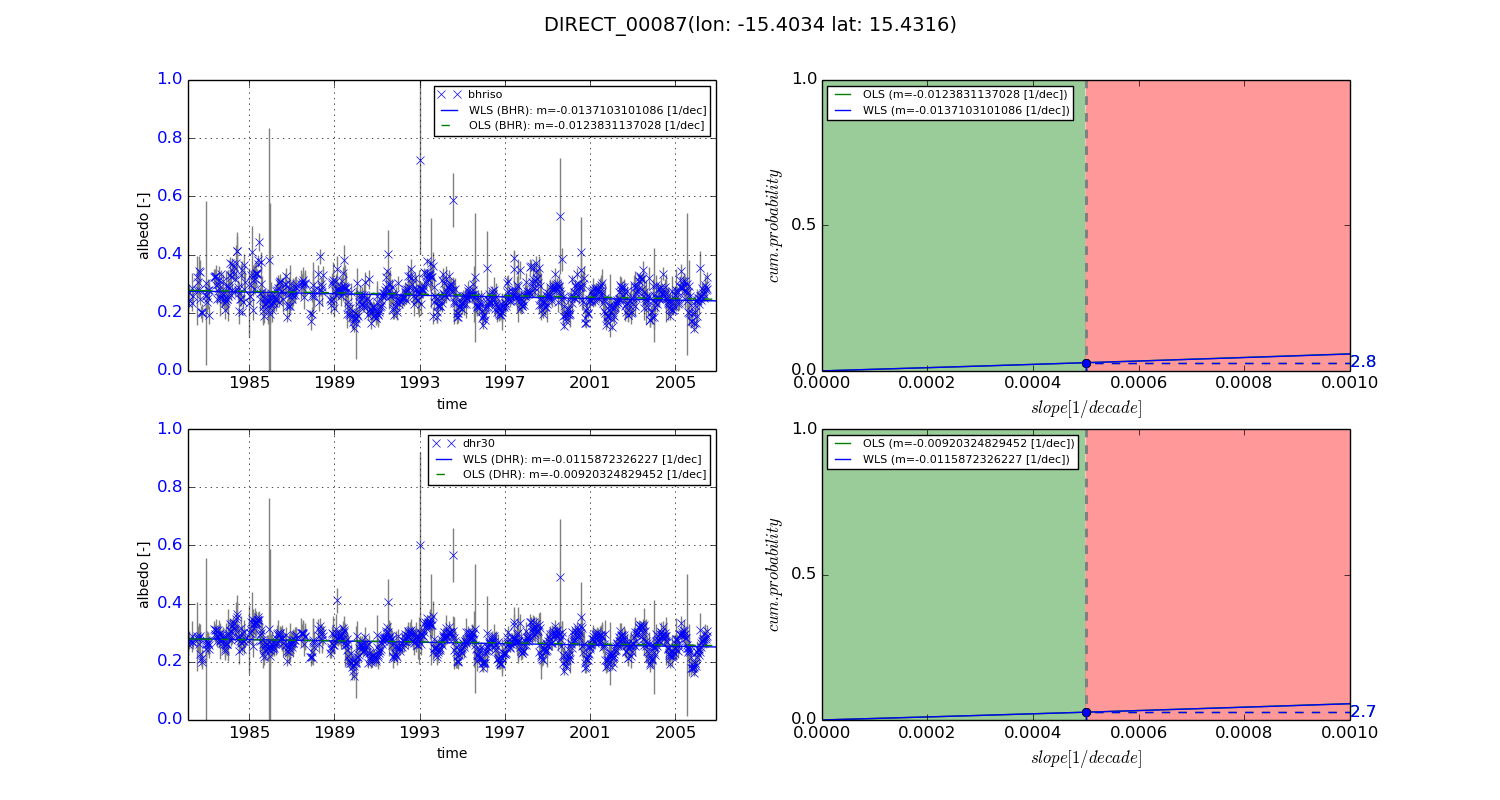
Temporal stability analysis

+000 deg (BHR)


BHR statistics

Temporal stability [1/decade]:


abs

rel


Weighted least square:

-0.0137103101086


Ordinary least square:

-0.0123831137028


Probabilities that GCOS criteria is met:

Weighted least square:

2.8 %

Ordinary least square:

2.8 %


DHR statistics

Temporal stability [1/decade]:


abs

rel


Weighted least square:

-0.0115872326227


Ordinary least square:

-0.00920324829452


Probabilities that GCOS criteria is met:

Weighted least square:

2.7 %

Ordinary least square:

2.7 %


+057/+063 deg (BHR)


BHR statistics

Temporal stability [1/decade]:


abs

rel


Weighted least square:

-99999.0


Ordinary least square:

-99999.0


Probabilities that GCOS criteria is met:

Weighted least square:

-99999.0 %

Ordinary least square:

-99999.0 %


DHR statistics

Temporal stability [1/decade]:


abs

rel


Weighted least square:

-99999.0


Ordinary least square:

-99999.0


Probabilities that GCOS criteria is met:

Weighted least square:

-99999.0 %

Ordinary least square:

-99999.0 %


Temporal anomaly analyis

The variance of the temporal anomalies provides an additional measure about the stability of the signal AFTER removal of the mean seasonal cylce.
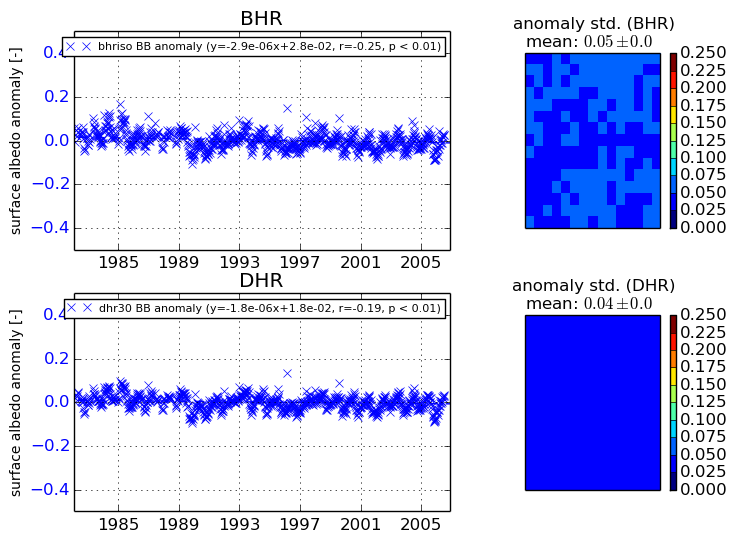
+000 deg


+057/+063 deg