DIRECT_00088


Location

lon / lat [deg]: -15.0609 / 15.8192

Source network: DIRECT


Geostationary surface albedo (GSA) data


“+000”


“+057/+063”


Landcover information (based on ESA CCI landcover data)


Landcover fractions @ 2km distance


Landcover fractions @ 20 km distance


Legend


Distance to open water bodies [km]:

44.69

Distance to urban areas [km]:

36.27


Radius: 1 km

Number of landcover classes:

1

Dominant landcover type:

100: Mosaic tree and shrub (>50%) / herbaceous cover (<50%)

Fraction of dominant landcover type [%]:

100.0


Radius: 2 km

Number of landcover classes:

1

Dominant landcover type:

100: Mosaic tree and shrub (>50%) / herbaceous cover (<50%)

Fraction of dominant landcover type [%]:

100.0


Radius: 5 km

Number of landcover classes:

4

Dominant landcover type:

100: Mosaic tree and shrub (>50%) / herbaceous cover (<50%)

Fraction of dominant landcover type [%]:

94.0


Radius: 10 km

Number of landcover classes:

3

Dominant landcover type:

100: Mosaic tree and shrub (>50%) / herbaceous cover (<50%)

Fraction of dominant landcover type [%]:

94.0


Radius: 20 km

Number of landcover classes:

5

Dominant landcover type:

100: Mosaic tree and shrub (>50%) / herbaceous cover (<50%)

Fraction of dominant landcover type [%]:

81.0


Disturbances


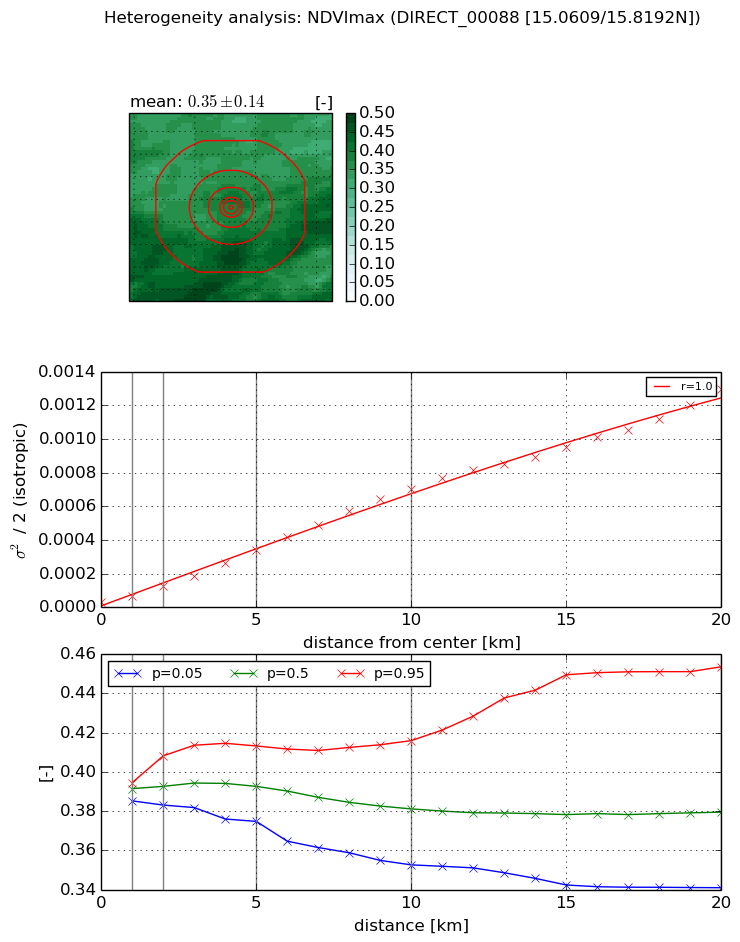
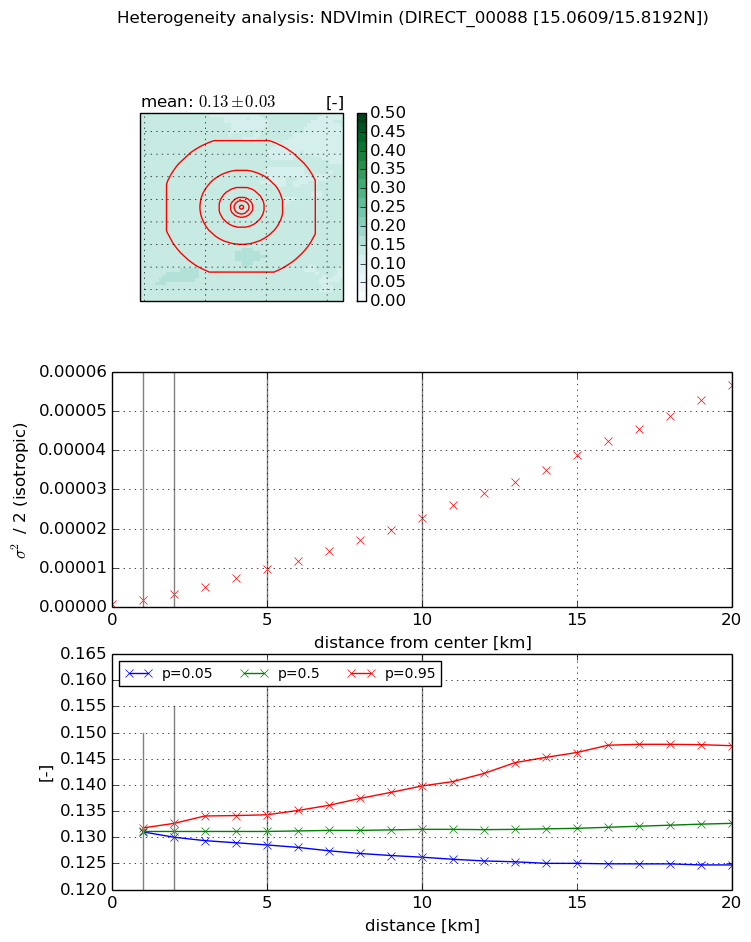
Heterogeneity analysis

The heterogeneity analysis provides information about the spatial and temporal heterogeneity of the site.

Topography


Roman et al. (2009) index


St

13.2546275644

Rcv

0.00330338586089

Rse

0.0

Rst

-0.0140705829034

Rsv

0.208962077679


Height range @ 1km [m]

7

Height range @ 2km [m]

8

Height range @ 5km [m]

8

Height range @ 10km [m]

-999

Height range @ 20km [m]

-999


Variance slope @ 1 km

1

Variance slope @ 2 km

1

Variance slope @ 5 km

0

Variance slope @ 10 km

-999

Variance slope @ 20 km

-999


NDVI (max. NDVI composite)


Roman et al. (2009) index


St

3.39905340391

Rcv

0.274530385246

Rse

0.0

Rst

-0.0772381116728

Rsv

0.530830169096


NDVI range @ 1km [-]

0.01

NDVI range @ 2km [-]

0.03

NDVI range @ 5km [-]

0.04

NDVI range @ 10km [-]

0.06

NDVI range @ 20km [-]

0.11


Variance slope @ 1 km

3.14857705457e-05

Variance slope @ 2 km

4.55307653486e-05

Variance slope @ 5 km

6.28619588587e-05

Variance slope @ 10 km

7.04744109224e-05

Variance slope @ 20 km

6.24230605241e-05


NDVI (min. NDVI composite)I


Roman et al. (2009) index


St

2.0729920335

Rcv

0.260648923191

Rse

0.0

Rst

-0.186534770171

Rsv

-0.999999871028


NDVI range @ 1km [-]

0.0

NDVI range @ 2km [-]

0.0

NDVI range @ 5km [-]

0.01

NDVI range @ 10km [-]

0.01

NDVI range @ 20km [-]

0.02


NDVI slope @ 1 km

8.4779544704e-07

NDVI slope @ 2 km

1.24477046301e-06

NDVI slope @ 5 km

1.78467933322e-06

NDVI slope @ 10 km

2.23177608606e-06

NDVI slope @ 20 km

2.85122040722e-06


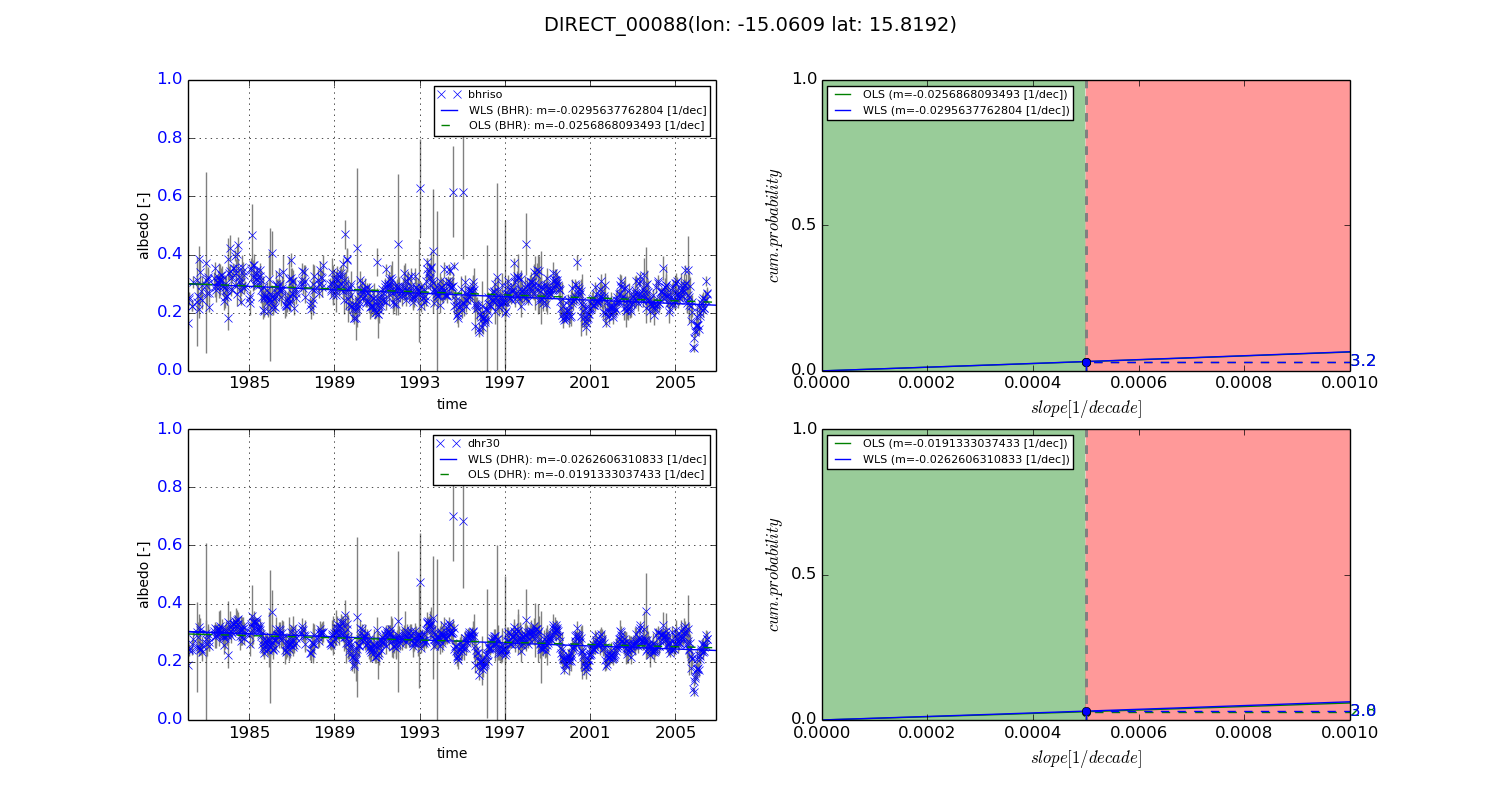
Temporal stability analysis

+000 deg (BHR)


BHR statistics

Temporal stability [1/decade]:


abs

rel


Weighted least square:

-0.0295637762804


Ordinary least square:

-0.0256868093493


Probabilities that GCOS criteria is met:

Weighted least square:

3.2 %

Ordinary least square:

3.2 %


DHR statistics

Temporal stability [1/decade]:


abs

rel


Weighted least square:

-0.0262606310833


Ordinary least square:

-0.0191333037433


Probabilities that GCOS criteria is met:

Weighted least square:

3.0 %

Ordinary least square:

2.8 %


+057/+063 deg (BHR)


BHR statistics

Temporal stability [1/decade]:


abs

rel


Weighted least square:

-99999.0


Ordinary least square:

-99999.0


Probabilities that GCOS criteria is met:

Weighted least square:

-99999.0 %

Ordinary least square:

-99999.0 %


DHR statistics

Temporal stability [1/decade]:


abs

rel


Weighted least square:

-99999.0


Ordinary least square:

-99999.0


Probabilities that GCOS criteria is met:

Weighted least square:

-99999.0 %

Ordinary least square:

-99999.0 %


Temporal anomaly analyis

The variance of the temporal anomalies provides an additional measure about the stability of the signal AFTER removal of the mean seasonal cylce.
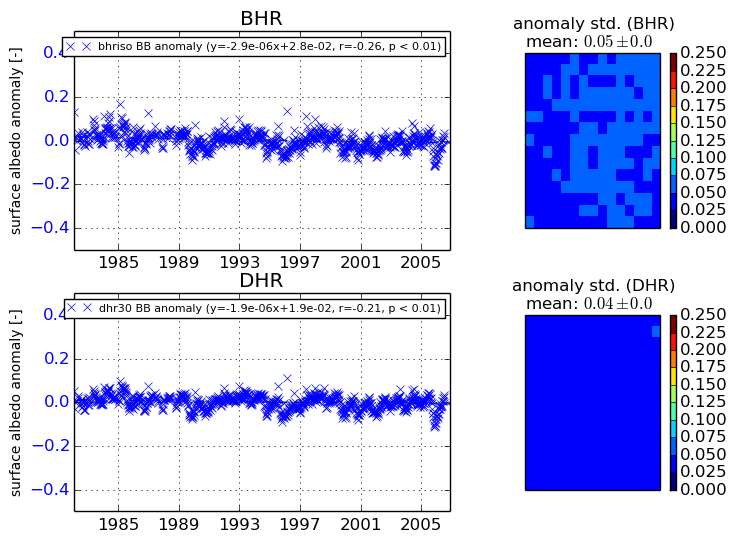
+000 deg


+057/+063 deg