DIRECT_00090


Location

lon / lat [deg]: 34.8533 / 0.3204

Source network: DIRECT


Geostationary surface albedo (GSA) data


“+000”


“+057/+063”


Landcover information (based on ESA CCI landcover data)


Landcover fractions @ 2km distance


Landcover fractions @ 20 km distance


Legend


Distance to open water bodies [km]:

30.16

Distance to urban areas [km]:

11.35


Radius: 1 km

Number of landcover classes:

2

Dominant landcover type:

40: mosaic natural vegetation (tree, shrub, herbaceous cover) (>50%) / cropland (<50%)

Fraction of dominant landcover type [%]:

62.0


Radius: 2 km

Number of landcover classes:

3

Dominant landcover type:

40: mosaic natural vegetation (tree, shrub, herbaceous cover) (>50%) / cropland (<50%)

Fraction of dominant landcover type [%]:

58.0


Radius: 5 km

Number of landcover classes:

4

Dominant landcover type:

40: mosaic natural vegetation (tree, shrub, herbaceous cover) (>50%) / cropland (<50%)

Fraction of dominant landcover type [%]:

47.0


Radius: 10 km

Number of landcover classes:

4

Dominant landcover type:

10: cropland, rainfed

Fraction of dominant landcover type [%]:

66.0


Radius: 20 km

Number of landcover classes:

3

Dominant landcover type:

10: cropland, rainfed

Fraction of dominant landcover type [%]:

81.0


Disturbances


Heterogeneity analysis

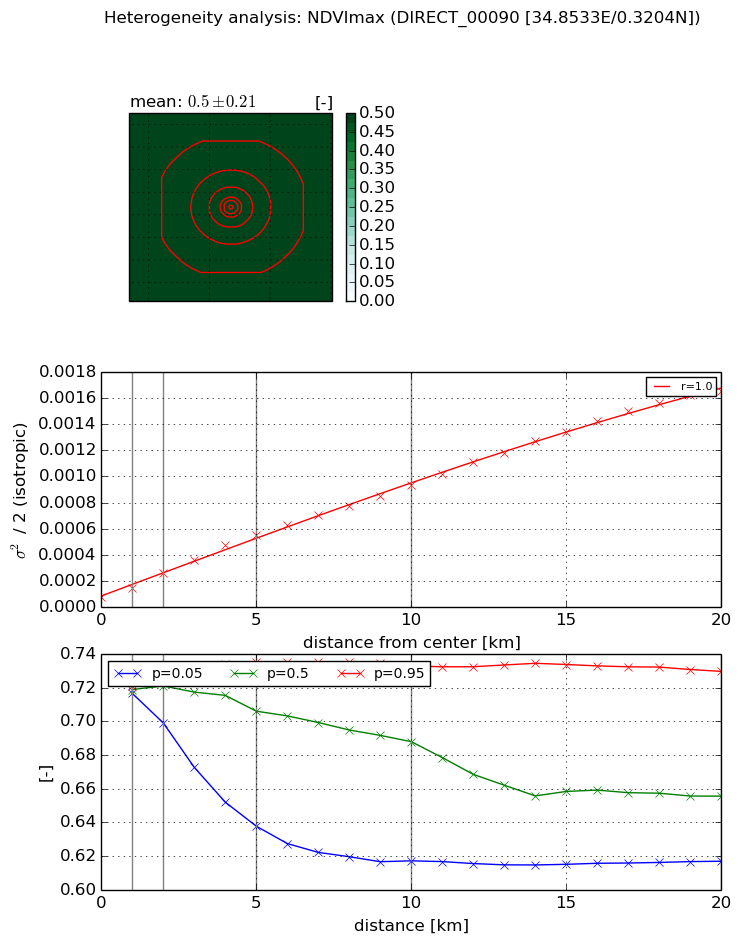
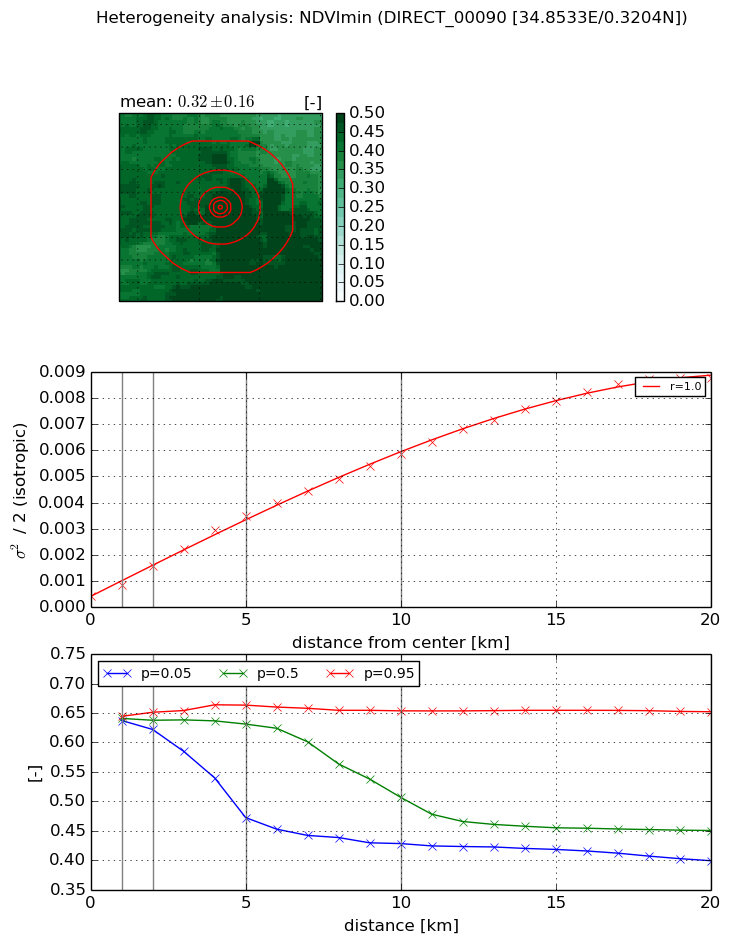
The heterogeneity analysis provides information about the spatial and temporal heterogeneity of the site.

Topography


Roman et al. (2009) index


St

6.56026925606

Rcv

0.313459719897

Rse

0.0

Rst

-0.0681199914183

Rsv

-0.0757185919873


Height range @ 1km [m]

33

Height range @ 2km [m]

57

Height range @ 5km [m]

70

Height range @ 10km [m]

-999

Height range @ 20km [m]

-999


Variance slope @ 1 km

242

Variance slope @ 2 km

158

Variance slope @ 5 km

94

Variance slope @ 10 km

-999

Variance slope @ 20 km

-999


NDVI (max. NDVI composite)


Roman et al. (2009) index


St

0.997553348828

Rcv

0.748141693361

Rse

0.0

Rst

1.60430111905e-10

Rsv

2.25921626234


NDVI range @ 1km [-]

0.0

NDVI range @ 2km [-]

0.03

NDVI range @ 5km [-]

0.1

NDVI range @ 10km [-]

0.12

NDVI range @ 20km [-]

0.11


Variance slope @ 1 km

6.43358633429e-05

Variance slope @ 2 km

8.83041832504e-05

Variance slope @ 5 km

9.87744624576e-05

Variance slope @ 10 km

8.60419765847e-05

Variance slope @ 20 km

8.03392064847e-05


NDVI (min. NDVI composite)I


Roman et al. (2009) index


St

2.60564163122e-10

Rcv

1.7625731668

Rse

0.0

Rst

-204.147597615

Rsv

11513478716.3


NDVI range @ 1km [-]

0.01

NDVI range @ 2km [-]

0.03

NDVI range @ 5km [-]

0.19

NDVI range @ 10km [-]

0.23

NDVI range @ 20km [-]

0.25


NDVI slope @ 1 km

0.000402956264436

NDVI slope @ 2 km

0.000561435404502

NDVI slope @ 5 km

0.000637384545327

NDVI slope @ 10 km

0.000552460475234

NDVI slope @ 20 km

0.000437859854082


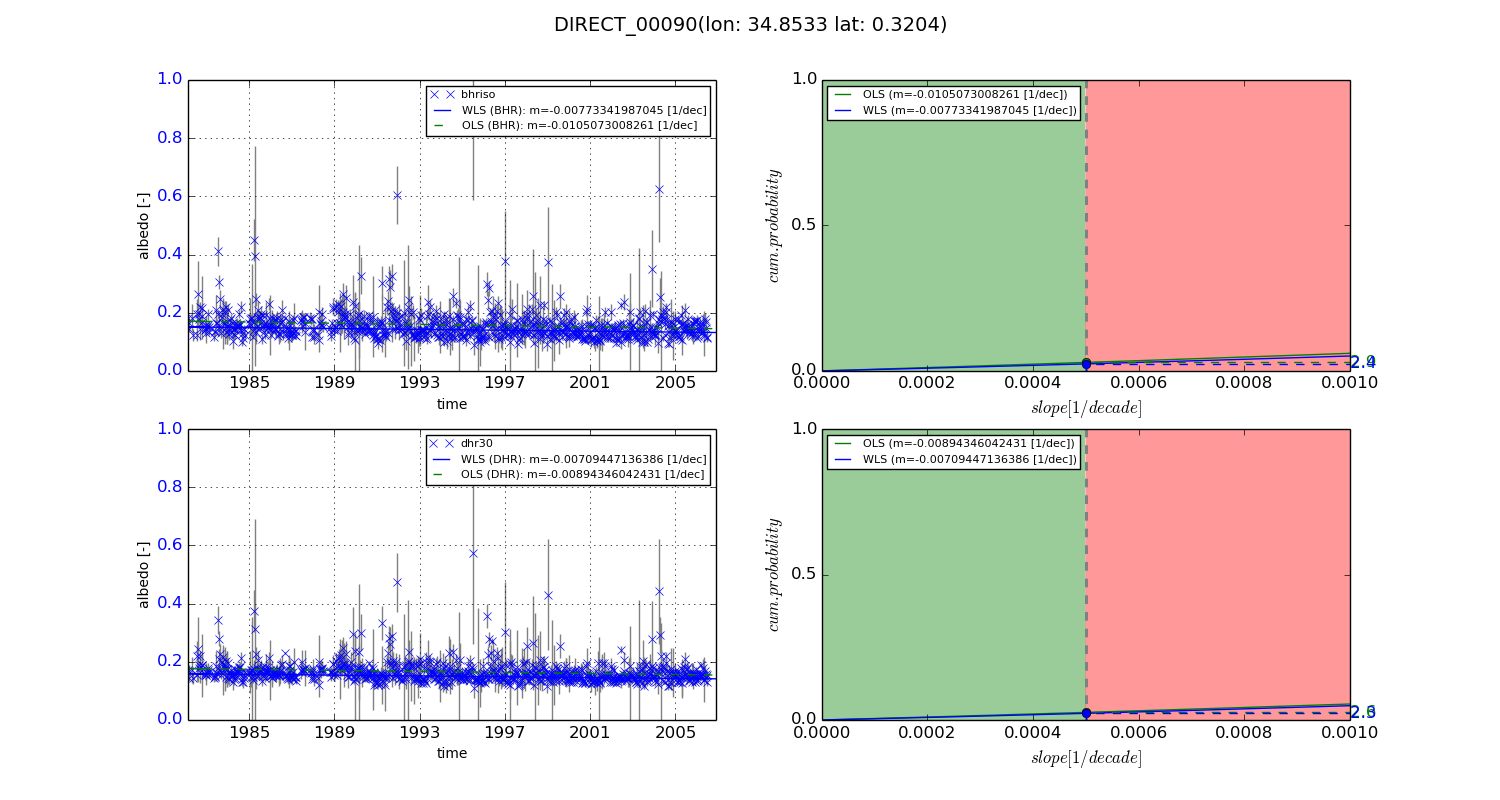
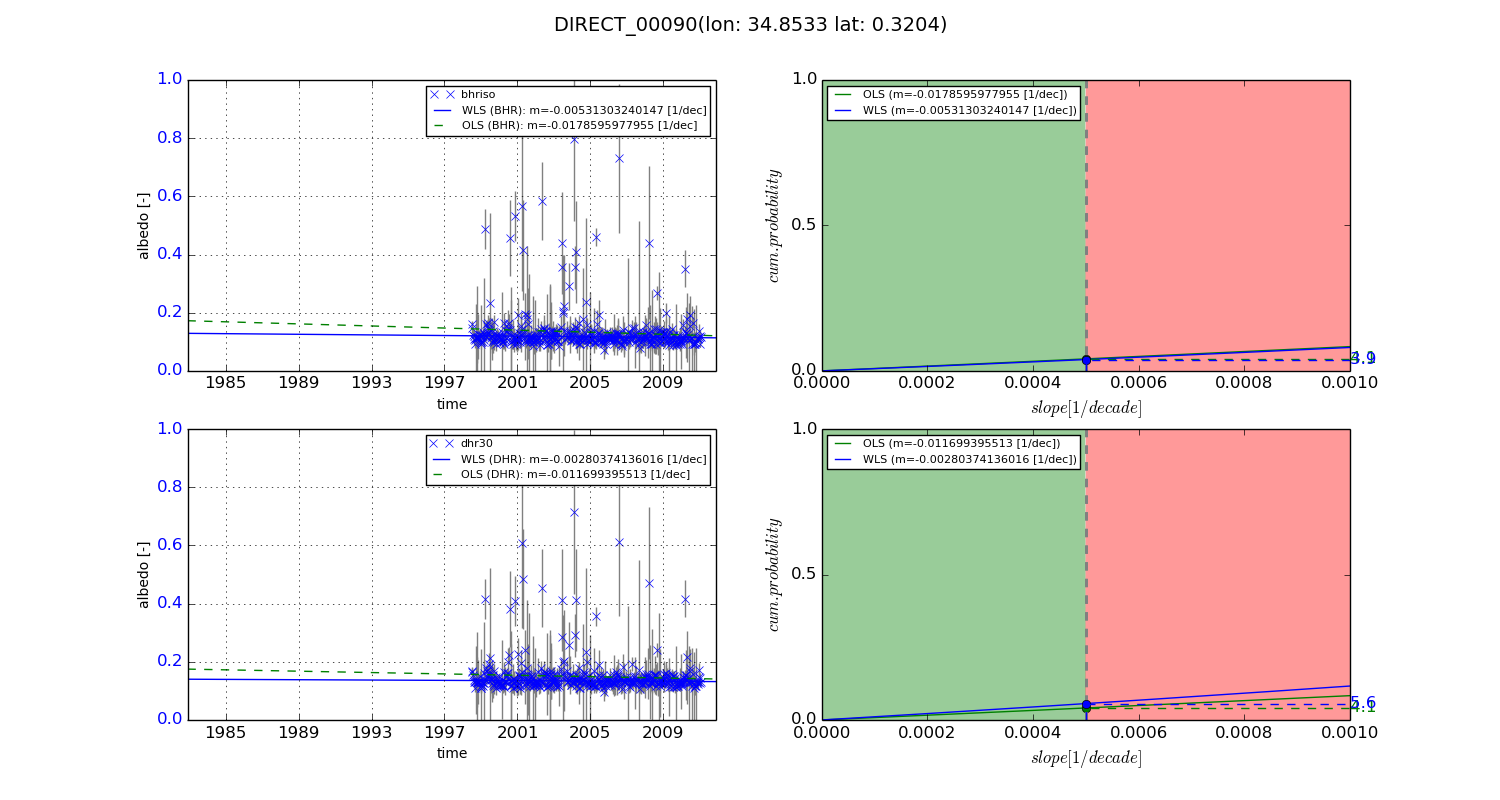
Temporal stability analysis

+000 deg (BHR)


BHR statistics

Temporal stability [1/decade]:


abs

rel


Weighted least square:

-0.00773341987045


Ordinary least square:

-0.0105073008261


Probabilities that GCOS criteria is met:

Weighted least square:

2.4 %

Ordinary least square:

2.9 %


DHR statistics

Temporal stability [1/decade]:


abs

rel


Weighted least square:

-0.00709447136386


Ordinary least square:

-0.00894346042431


Probabilities that GCOS criteria is met:

Weighted least square:

2.3 %

Ordinary least square:

2.6 %


+057/+063 deg (BHR)


BHR statistics

Temporal stability [1/decade]:


abs

rel


Weighted least square:

-0.00531303240147


Ordinary least square:

-0.0178595977955


Probabilities that GCOS criteria is met:

Weighted least square:

3.9 %

Ordinary least square:

4.1 %


DHR statistics

Temporal stability [1/decade]:


abs

rel


Weighted least square:

-0.00280374136016


Ordinary least square:

-0.011699395513


Probabilities that GCOS criteria is met:

Weighted least square:

5.6 %

Ordinary least square:

4.1 %


Temporal anomaly analyis

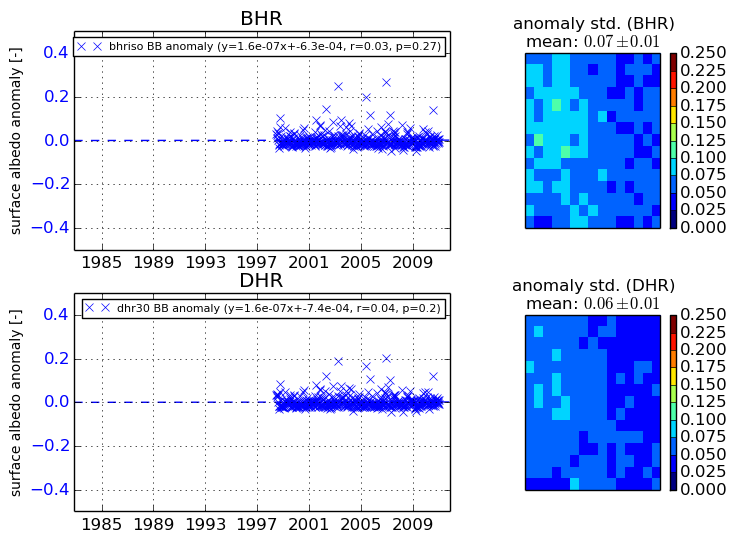
The variance of the temporal anomalies provides an additional measure about the stability of the signal AFTER removal of the mean seasonal cylce.
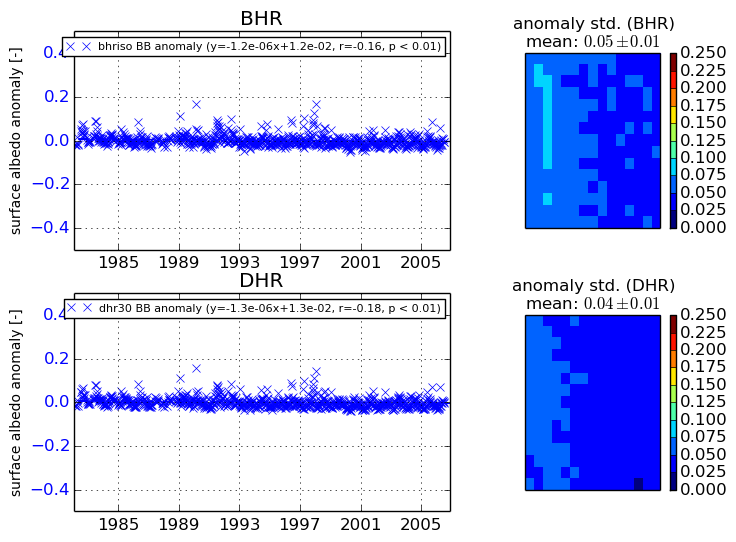
+000 deg


+057/+063 deg