DIRECT_00091


Location

lon / lat [deg]: 34.8768 / 0.2649

Source network: DIRECT


Geostationary surface albedo (GSA) data


“+000”


“+057/+063”


Landcover information (based on ESA CCI landcover data)


Landcover fractions @ 2km distance


Landcover fractions @ 20 km distance


Legend


Distance to open water bodies [km]:

36.79

Distance to urban areas [km]:

13.6


Radius: 1 km

Number of landcover classes:

3

Dominant landcover type:

40: mosaic natural vegetation (tree, shrub, herbaceous cover) (>50%) / cropland (<50%)

Fraction of dominant landcover type [%]:

45.0


Radius: 2 km

Number of landcover classes:

3

Dominant landcover type:

40: mosaic natural vegetation (tree, shrub, herbaceous cover) (>50%) / cropland (<50%)

Fraction of dominant landcover type [%]:

80.0


Radius: 5 km

Number of landcover classes:

4

Dominant landcover type:

40: mosaic natural vegetation (tree, shrub, herbaceous cover) (>50%) / cropland (<50%)

Fraction of dominant landcover type [%]:

45.0


Radius: 10 km

Number of landcover classes:

5

Dominant landcover type:

10: cropland, rainfed

Fraction of dominant landcover type [%]:

56.0


Radius: 20 km

Number of landcover classes:

4

Dominant landcover type:

10: cropland, rainfed

Fraction of dominant landcover type [%]:

80.0


Disturbances


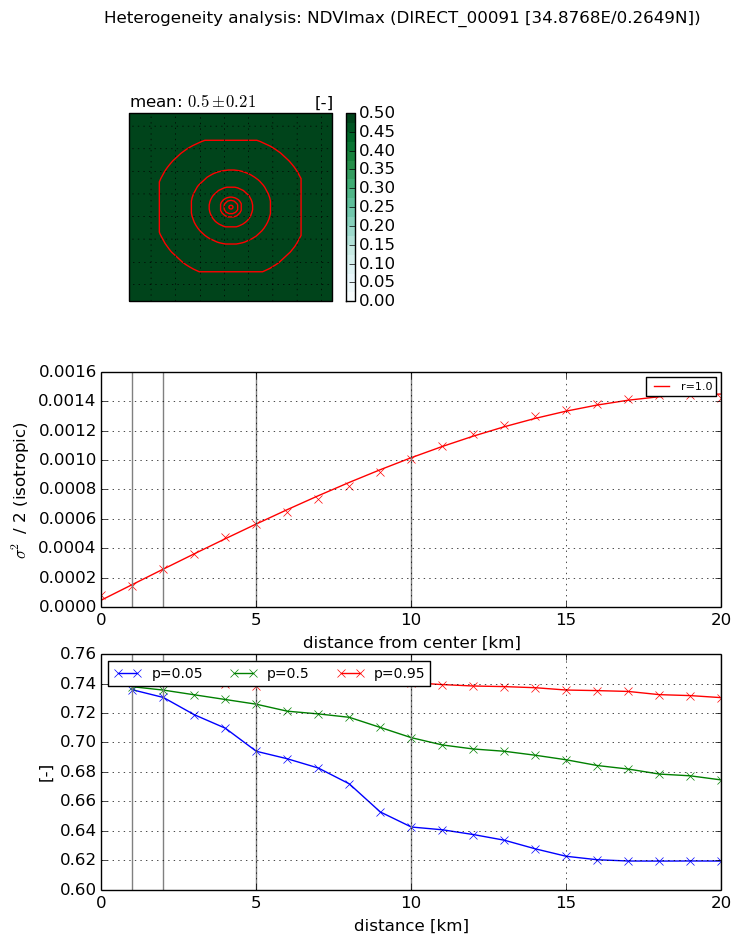
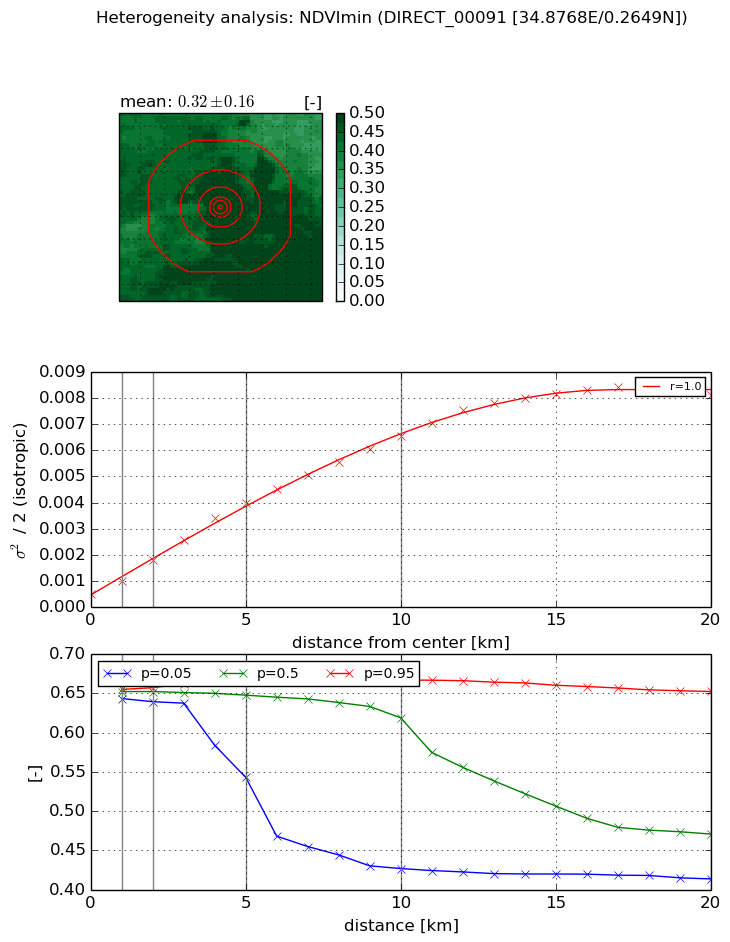
Heterogeneity analysis

The heterogeneity analysis provides information about the spatial and temporal heterogeneity of the site.

Topography


Roman et al. (2009) index


St

0.0670754109296

Rcv

0.338028550902

Rse

0.0

Rst

-0.13530166673

Rsv

44.2524486993


Height range @ 1km [m]

39

Height range @ 2km [m]

48

Height range @ 5km [m]

74

Height range @ 10km [m]

-999

Height range @ 20km [m]

-999


Variance slope @ 1 km

249

Variance slope @ 2 km

192

Variance slope @ 5 km

96

Variance slope @ 10 km

-999

Variance slope @ 20 km

-999


NDVI (max. NDVI composite)


Roman et al. (2009) index


St

1.39830130571

Rcv

0.906618389208

Rse

0.0

Rst

-0.338426935938

Rsv

0.90041501859


NDVI range @ 1km [-]

0.01

NDVI range @ 2km [-]

0.01

NDVI range @ 5km [-]

0.04

NDVI range @ 10km [-]

0.1

NDVI range @ 20km [-]

0.11


Variance slope @ 1 km

6.42438645328e-05

Variance slope @ 2 km

8.8175973062e-05

Variance slope @ 5 km

0.000100623821772

Variance slope @ 10 km

9.42613503071e-05

Variance slope @ 20 km

7.31063611345e-05


NDVI (min. NDVI composite)I


Roman et al. (2009) index


St

0.45483500833

Rcv

5.22032384784

Rse

0.0

Rst

-0.375474649821

Rsv

-0.999999857915


NDVI range @ 1km [-]

0.01

NDVI range @ 2km [-]

0.02

NDVI range @ 5km [-]

0.12

NDVI range @ 10km [-]

0.24

NDVI range @ 20km [-]

0.24


NDVI slope @ 1 km

0.000471448636233

NDVI slope @ 2 km

0.000648336878488

NDVI slope @ 5 km

0.000725205400881

NDVI slope @ 10 km

0.000616421560587

NDVI slope @ 20 km

0.00040709755423


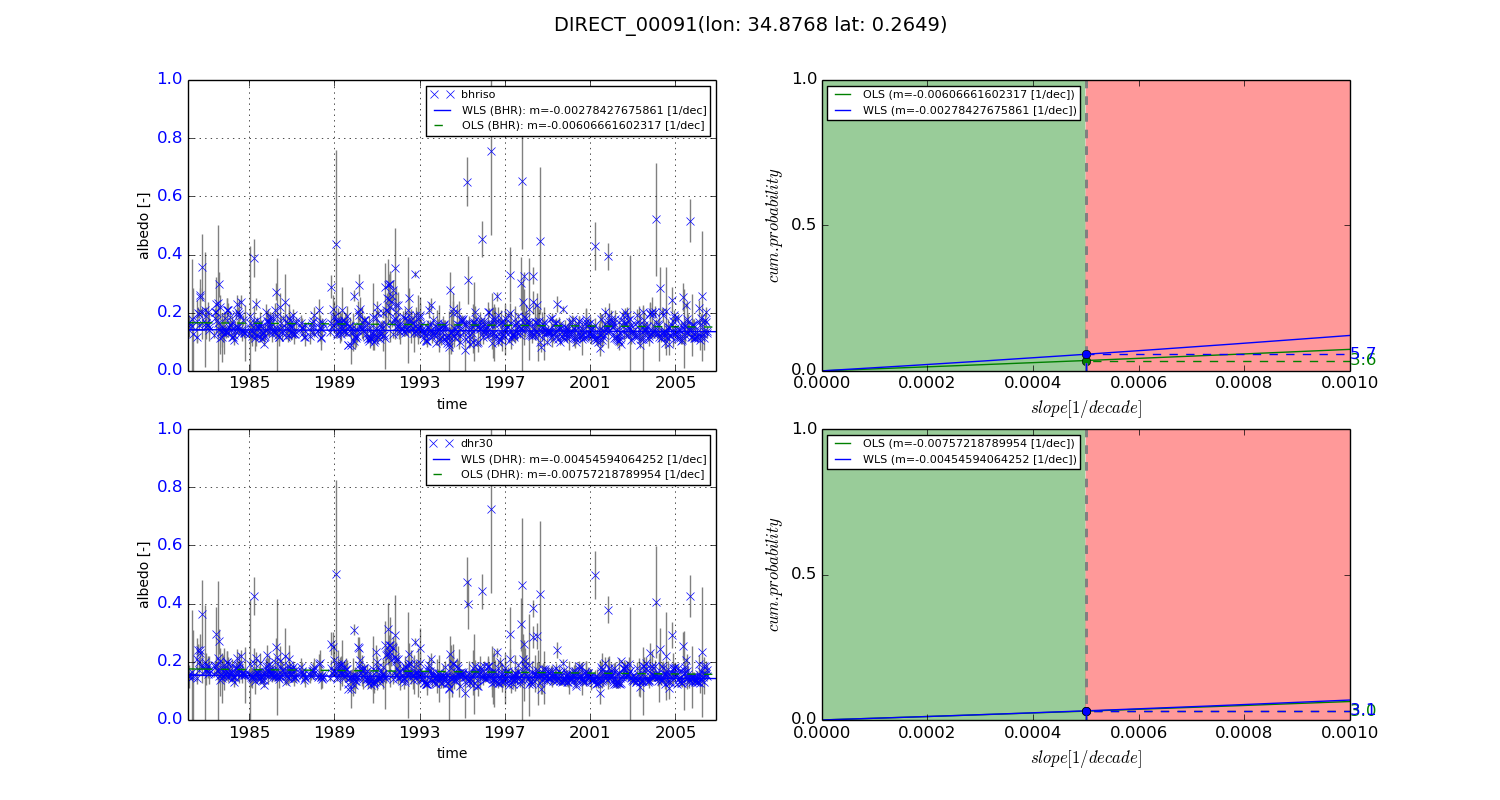
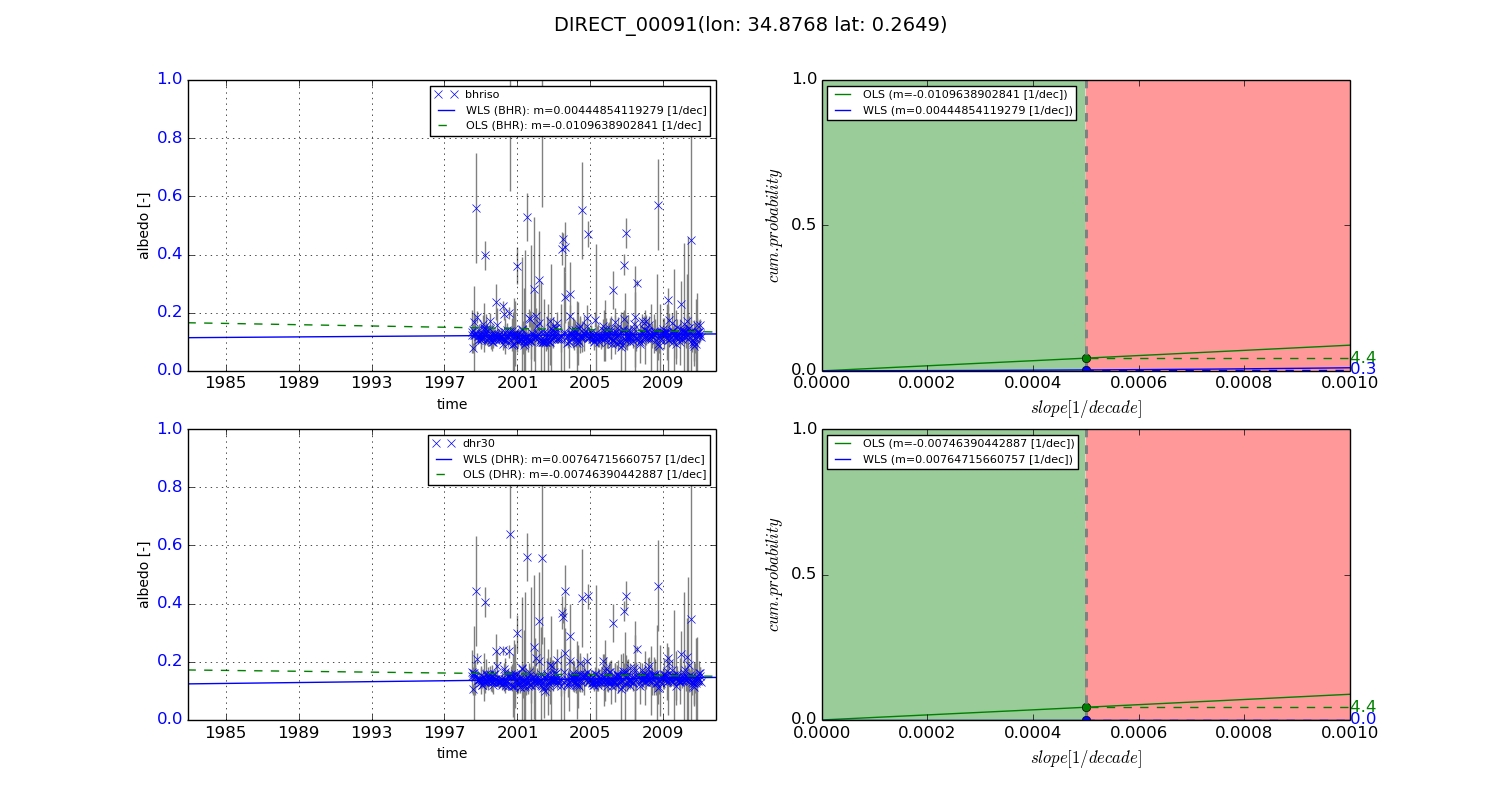
Temporal stability analysis

+000 deg (BHR)


BHR statistics

Temporal stability [1/decade]:


abs

rel


Weighted least square:

-0.00278427675861


Ordinary least square:

-0.00606661602317


Probabilities that GCOS criteria is met:

Weighted least square:

5.7 %

Ordinary least square:

3.6 %


DHR statistics

Temporal stability [1/decade]:


abs

rel


Weighted least square:

-0.00454594064252


Ordinary least square:

-0.00757218789954


Probabilities that GCOS criteria is met:

Weighted least square:

3.1 %

Ordinary least square:

3.0 %


+057/+063 deg (BHR)


BHR statistics

Temporal stability [1/decade]:


abs

rel


Weighted least square:

0.00444854119279


Ordinary least square:

-0.0109638902841


Probabilities that GCOS criteria is met:

Weighted least square:

0.3 %

Ordinary least square:

4.4 %


DHR statistics

Temporal stability [1/decade]:


abs

rel


Weighted least square:

0.00764715660757


Ordinary least square:

-0.00746390442887


Probabilities that GCOS criteria is met:

Weighted least square:

0.0 %

Ordinary least square:

4.4 %


Temporal anomaly analyis

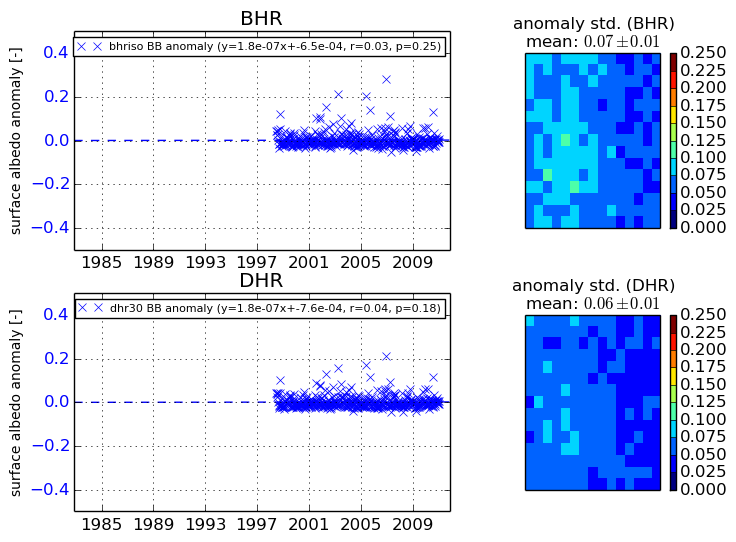
The variance of the temporal anomalies provides an additional measure about the stability of the signal AFTER removal of the mean seasonal cylce.
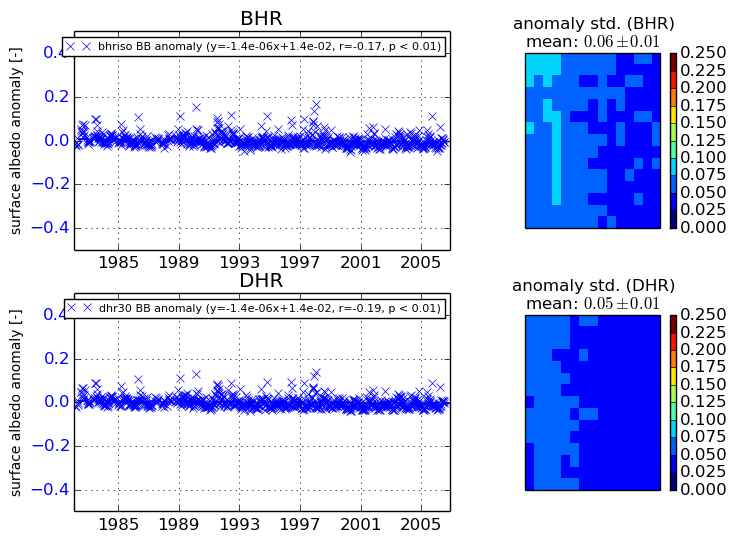
+000 deg


+057/+063 deg