DIRECT_00093


Location

lon / lat [deg]: 31.4891 / 1.7532

Source network: DIRECT


Geostationary surface albedo (GSA) data


“+000”


“+057/+063”


Landcover information (based on ESA CCI landcover data)


Landcover fractions @ 2km distance


Landcover fractions @ 20 km distance


Legend


Distance to open water bodies [km]:

15.15

Distance to urban areas [km]:

25.41


Radius: 1 km

Number of landcover classes:

1

Dominant landcover type:

50: Tree cover, broadleaved, evergreen, closed to open (>15%)

Fraction of dominant landcover type [%]:

100.0


Radius: 2 km

Number of landcover classes:

1

Dominant landcover type:

50: Tree cover, broadleaved, evergreen, closed to open (>15%)

Fraction of dominant landcover type [%]:

100.0


Radius: 5 km

Number of landcover classes:

4

Dominant landcover type:

50: Tree cover, broadleaved, evergreen, closed to open (>15%)

Fraction of dominant landcover type [%]:

77.0


Radius: 10 km

Number of landcover classes:

5

Dominant landcover type:

50: Tree cover, broadleaved, evergreen, closed to open (>15%)

Fraction of dominant landcover type [%]:

59.0


Radius: 20 km

Number of landcover classes:

8

Dominant landcover type:

10: cropland, rainfed

Fraction of dominant landcover type [%]:

49.0


Disturbances


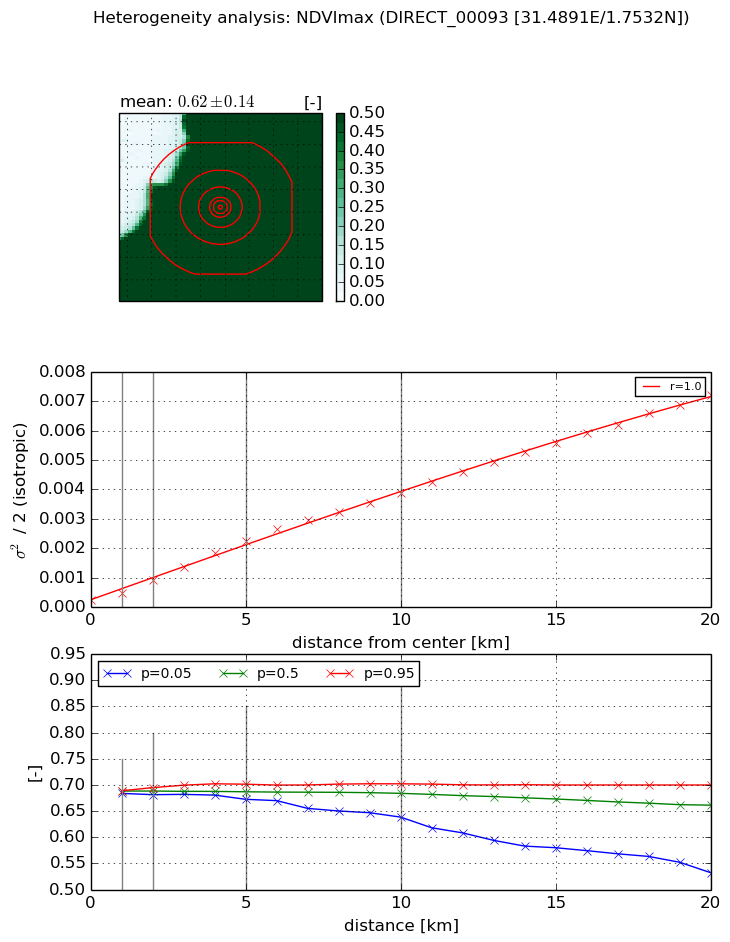
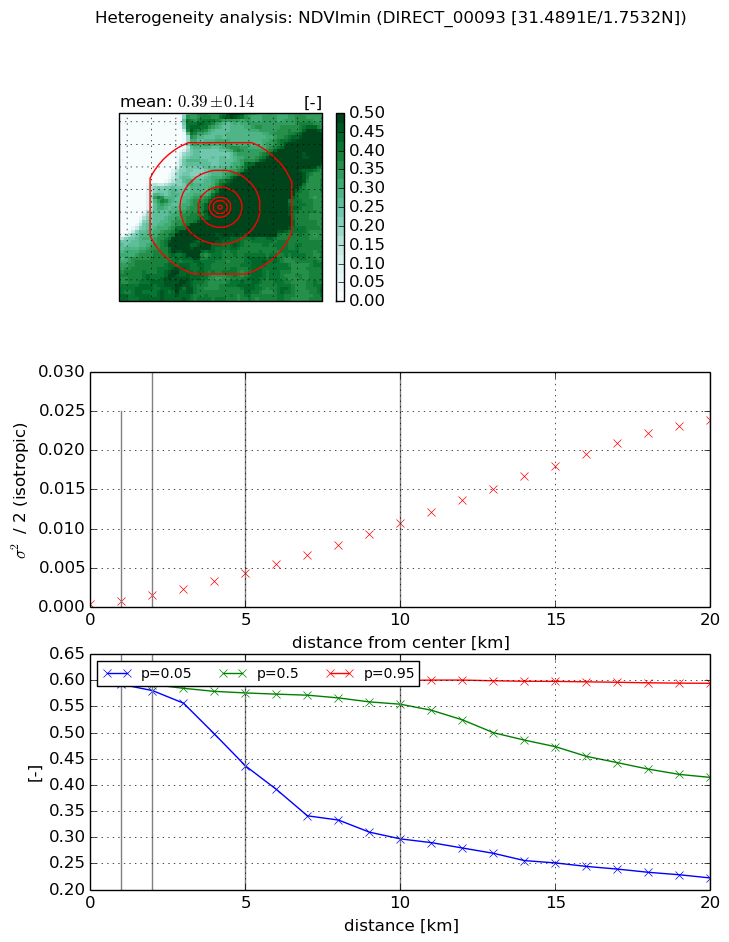
Heterogeneity analysis

The heterogeneity analysis provides information about the spatial and temporal heterogeneity of the site.

Topography


Roman et al. (2009) index


St

3.05028732627e-07

Rcv

0.43529926398

Rse

0.0

Rst

-0.00735877931205

Rsv

9835138.60856


Height range @ 1km [m]

50

Height range @ 2km [m]

55

Height range @ 5km [m]

102

Height range @ 10km [m]

-999

Height range @ 20km [m]

-999


Variance slope @ 1 km

286

Variance slope @ 2 km

231

Variance slope @ 5 km

213

Variance slope @ 10 km

-999

Variance slope @ 20 km

-999


NDVI (max. NDVI composite)


Roman et al. (2009) index


St

5.48098087894

Rcv

0.325472208963

Rse

0.0

Rst

-0.139897966735

Rsv

0.0819771087142


NDVI range @ 1km [-]

0.01

NDVI range @ 2km [-]

0.01

NDVI range @ 5km [-]

0.03

NDVI range @ 10km [-]

0.06

NDVI range @ 20km [-]

0.17


Variance slope @ 1 km

0.00023228913552

Variance slope @ 2 km

0.000333343406136

Variance slope @ 5 km

0.00041891900499

Variance slope @ 10 km

0.000377388025848

Variance slope @ 20 km

0.000348009604487


NDVI (min. NDVI composite)I


Roman et al. (2009) index


St

0.647950484866

Rcv

3.04628360871

Rse

0.0

Rst

-0.583701970081

Rsv

-0.999997838258


NDVI range @ 1km [-]

0.0

NDVI range @ 2km [-]

0.02

NDVI range @ 5km [-]

0.16

NDVI range @ 10km [-]

0.3

NDVI range @ 20km [-]

0.37


NDVI slope @ 1 km

0.000383951812305

NDVI slope @ 2 km

0.00055996407692

NDVI slope @ 5 km

0.000814669940767

NDVI slope @ 10 km

0.00105310329382

NDVI slope @ 20 km

0.0012755218264


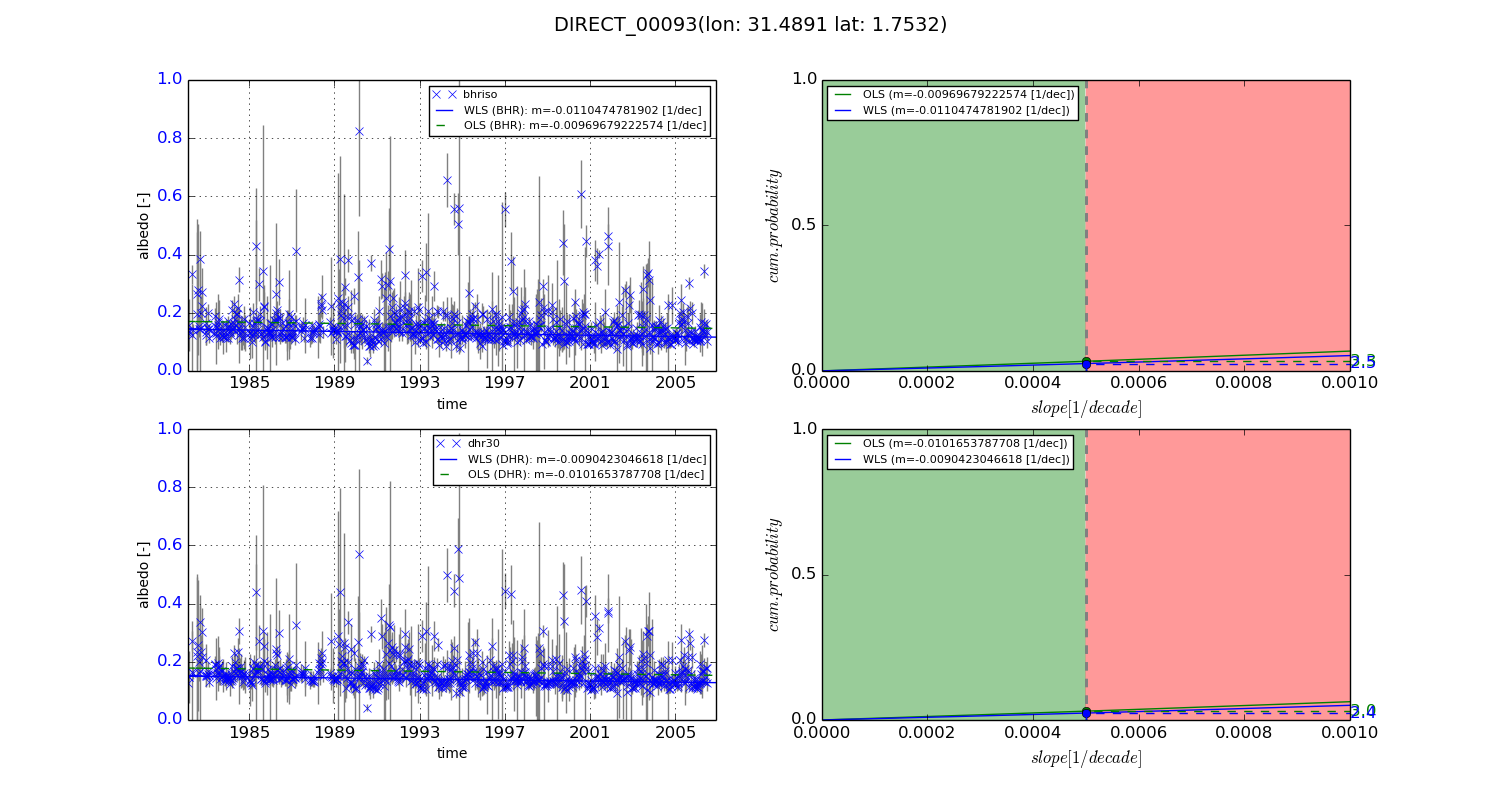
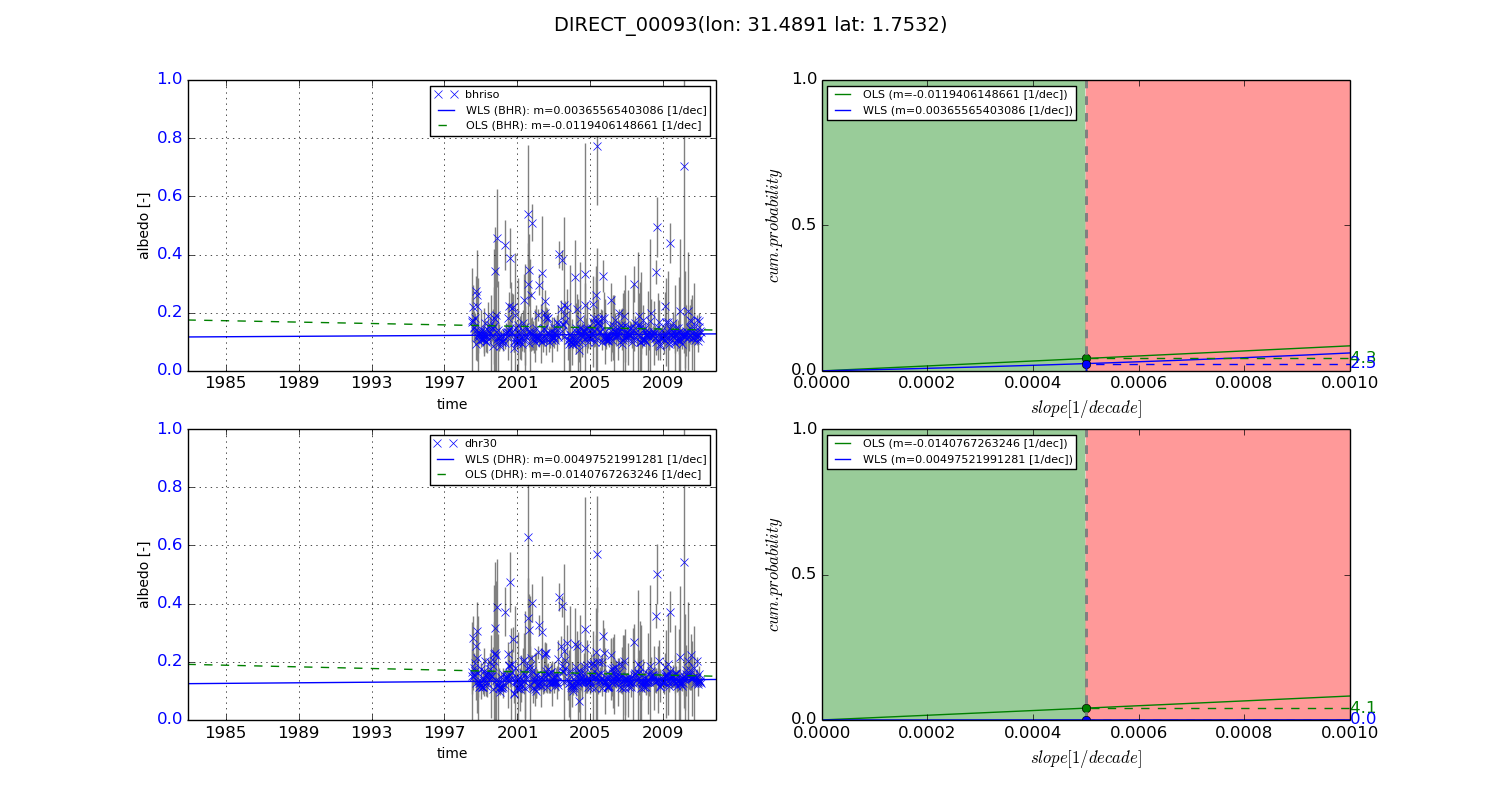
Temporal stability analysis

+000 deg (BHR)


BHR statistics

Temporal stability [1/decade]:


abs

rel


Weighted least square:

-0.0110474781902


Ordinary least square:

-0.00969679222574


Probabilities that GCOS criteria is met:

Weighted least square:

2.5 %

Ordinary least square:

3.3 %


DHR statistics

Temporal stability [1/decade]:


abs

rel


Weighted least square:

-0.0090423046618


Ordinary least square:

-0.0101653787708


Probabilities that GCOS criteria is met:

Weighted least square:

2.4 %

Ordinary least square:

3.0 %


+057/+063 deg (BHR)


BHR statistics

Temporal stability [1/decade]:


abs

rel


Weighted least square:

0.00365565403086


Ordinary least square:

-0.0119406148661


Probabilities that GCOS criteria is met:

Weighted least square:

2.5 %

Ordinary least square:

4.3 %


DHR statistics

Temporal stability [1/decade]:


abs

rel


Weighted least square:

0.00497521991281


Ordinary least square:

-0.0140767263246


Probabilities that GCOS criteria is met:

Weighted least square:

0.0 %

Ordinary least square:

4.1 %


Temporal anomaly analyis

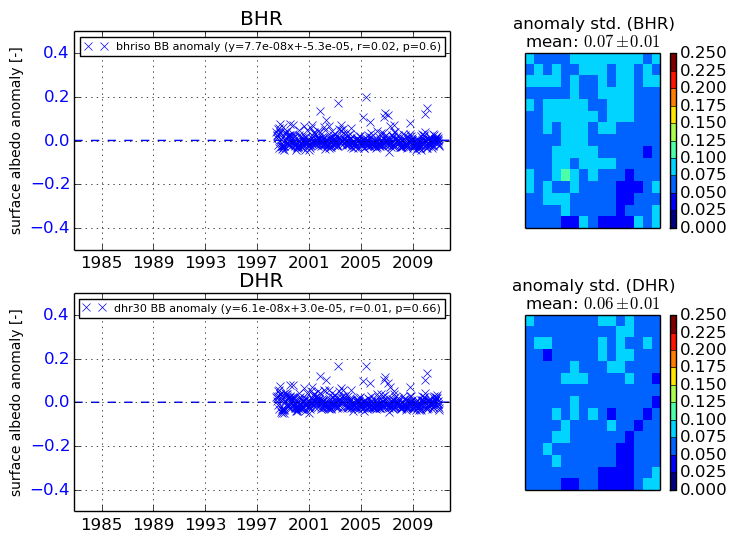
The variance of the temporal anomalies provides an additional measure about the stability of the signal AFTER removal of the mean seasonal cylce.
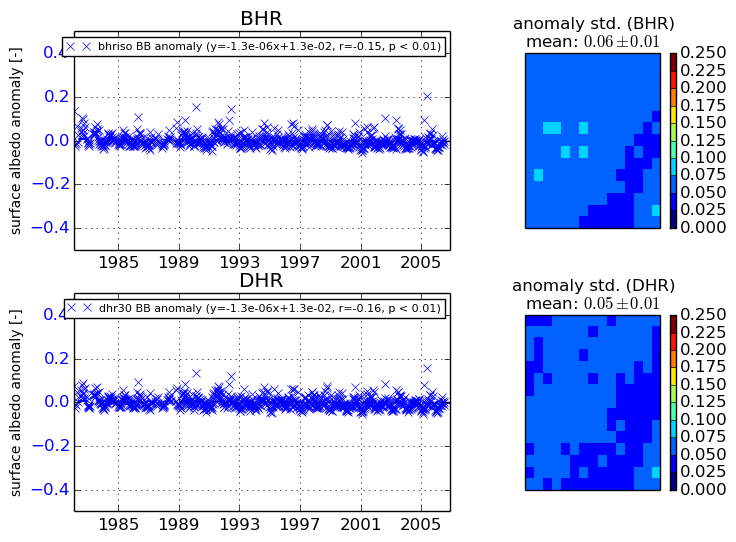
+000 deg


+057/+063 deg