DIRECT_00100


Location

lon / lat [deg]: -1.2646 / 39.5807

Source network: DIRECT


Geostationary surface albedo (GSA) data


“+000”


“+057/+063”


Landcover information (based on ESA CCI landcover data)


Landcover fractions @ 2km distance


Landcover fractions @ 20 km distance


Legend


Distance to open water bodies [km]:

18.16

Distance to urban areas [km]:

2.55


Radius: 1 km

Number of landcover classes:

3

Dominant landcover type:

20: cropland, irrigated or post-flooded

Fraction of dominant landcover type [%]:

50.0


Radius: 2 km

Number of landcover classes:

3

Dominant landcover type:

12: cropland, tree or shrub cover

Fraction of dominant landcover type [%]:

53.0


Radius: 5 km

Number of landcover classes:

4

Dominant landcover type:

12: cropland, tree or shrub cover

Fraction of dominant landcover type [%]:

41.0


Radius: 10 km

Number of landcover classes:

8

Dominant landcover type:

10: cropland, rainfed

Fraction of dominant landcover type [%]:

42.0


Radius: 20 km

Number of landcover classes:

7

Dominant landcover type:

10: cropland, rainfed

Fraction of dominant landcover type [%]:

33.0


Disturbances


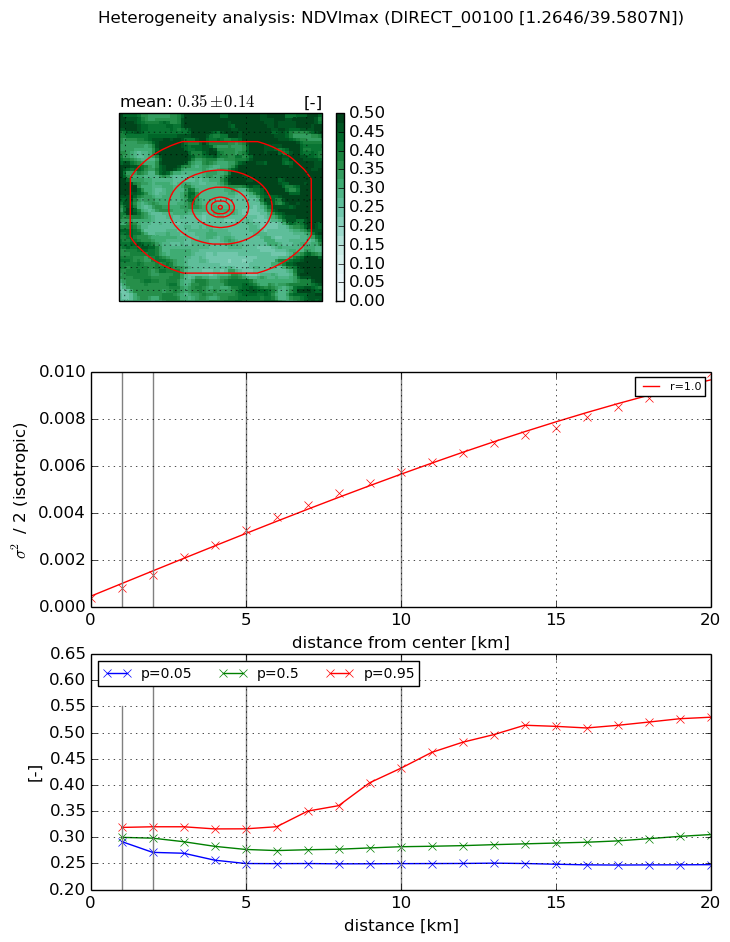
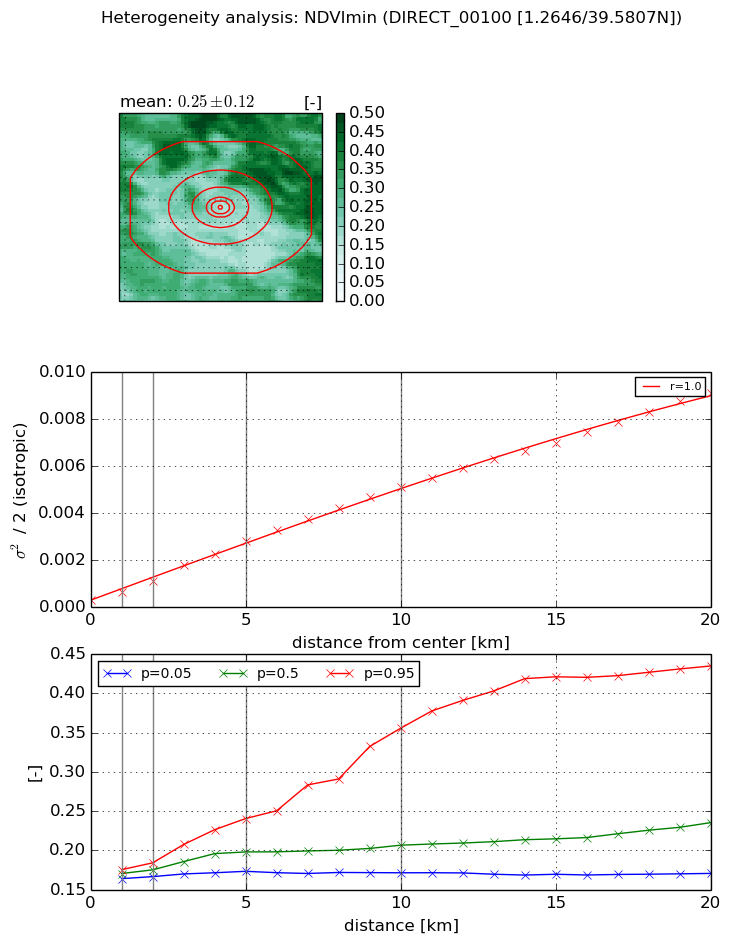
Heterogeneity analysis

The heterogeneity analysis provides information about the spatial and temporal heterogeneity of the site.

Topography


Roman et al. (2009) index


St

1.63749962332

Rcv

0.832059945413

Rse

0.0

Rst

-1.54472454219e-06

Rsv

-0.999999999999


Height range @ 1km [m]

19

Height range @ 2km [m]

38

Height range @ 5km [m]

136

Height range @ 10km [m]

-999

Height range @ 20km [m]

-999


Variance slope @ 1 km

234

Variance slope @ 2 km

335

Variance slope @ 5 km

460

Variance slope @ 10 km

-999

Variance slope @ 20 km

-999


NDVI (max. NDVI composite)


Roman et al. (2009) index


St

nan

Rcv

nan

Rse

nan

Rst

nan

Rsv

nan


NDVI range @ 1km [-]

0.03

NDVI range @ 2km [-]

0.05

NDVI range @ 5km [-]

0.07

NDVI range @ 10km [-]

0.18

NDVI range @ 20km [-]

0.28


Variance slope @ 1 km

0.000452642393841

Variance slope @ 2 km

0.000495177591298

Variance slope @ 5 km

0.000590535300931

Variance slope @ 10 km

0.00055132577902

Variance slope @ 20 km

0.000466372874615


NDVI (min. NDVI composite)I


Roman et al. (2009) index


St

0.924410735617

Rcv

0.592346181384

Rse

0.0

Rst

-0.526130977032

Rsv

2.12683348588


NDVI range @ 1km [-]

0.01

NDVI range @ 2km [-]

0.02

NDVI range @ 5km [-]

0.07

NDVI range @ 10km [-]

0.18

NDVI range @ 20km [-]

0.26


NDVI slope @ 1 km

0.000373661019847

NDVI slope @ 2 km

0.000412719118127

NDVI slope @ 5 km

0.00051605818597

NDVI slope @ 10 km

0.000494958731038

NDVI slope @ 20 km

0.000438897808379


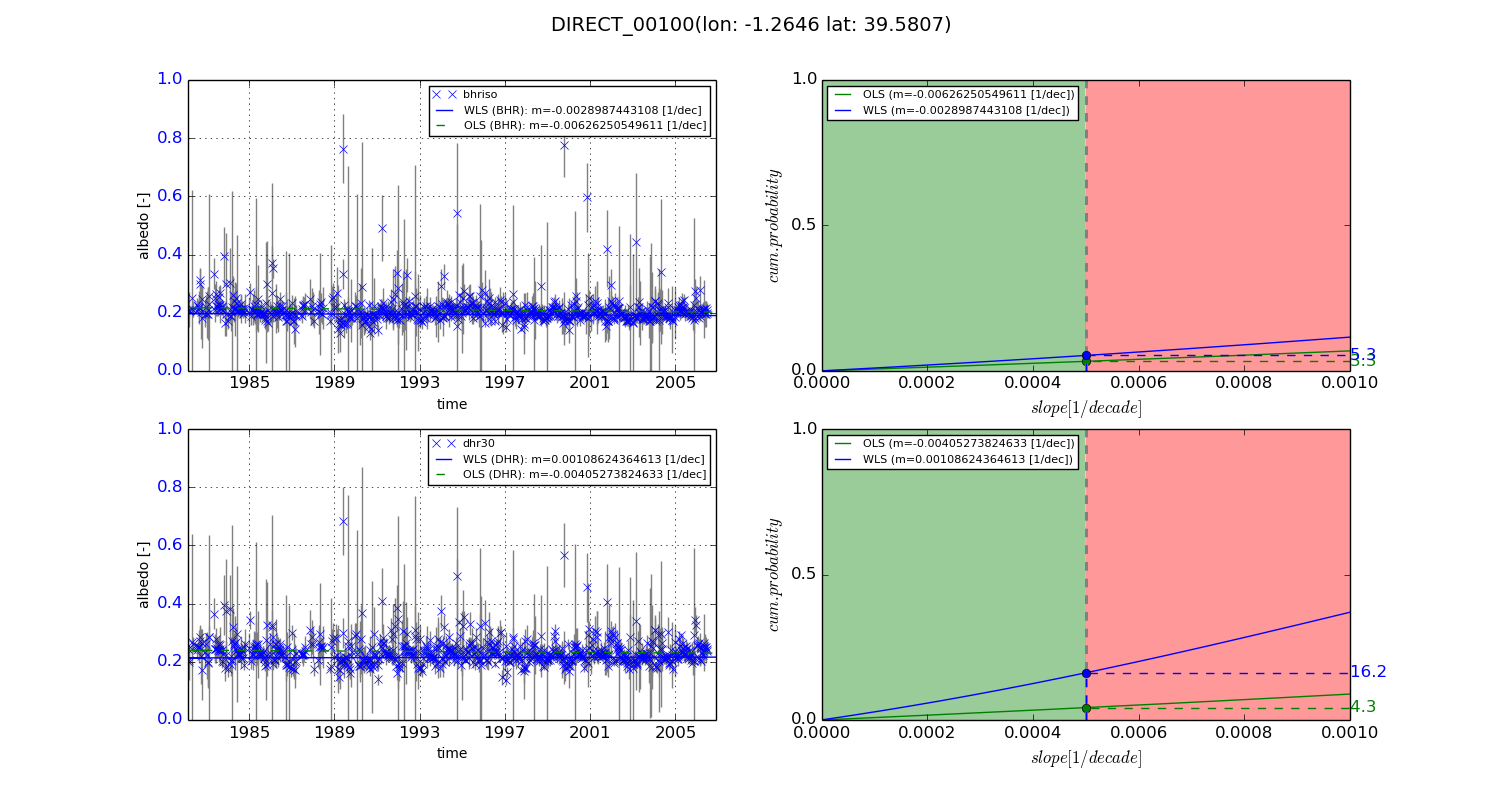
Temporal stability analysis

+000 deg (BHR)


BHR statistics

Temporal stability [1/decade]:


abs

rel


Weighted least square:

-0.0028987443108


Ordinary least square:

-0.00626250549611


Probabilities that GCOS criteria is met:

Weighted least square:

5.3 %

Ordinary least square:

3.3 %


DHR statistics

Temporal stability [1/decade]:


abs

rel


Weighted least square:

0.00108624364613


Ordinary least square:

-0.00405273824633


Probabilities that GCOS criteria is met:

Weighted least square:

16.2 %

Ordinary least square:

4.3 %


+057/+063 deg (BHR)


BHR statistics

Temporal stability [1/decade]:


abs

rel


Weighted least square:

-99999.0


Ordinary least square:

-99999.0


Probabilities that GCOS criteria is met:

Weighted least square:

-99999.0 %

Ordinary least square:

-99999.0 %


DHR statistics

Temporal stability [1/decade]:


abs

rel


Weighted least square:

-99999.0


Ordinary least square:

-99999.0


Probabilities that GCOS criteria is met:

Weighted least square:

-99999.0 %

Ordinary least square:

-99999.0 %


Temporal anomaly analyis

The variance of the temporal anomalies provides an additional measure about the stability of the signal AFTER removal of the mean seasonal cylce.
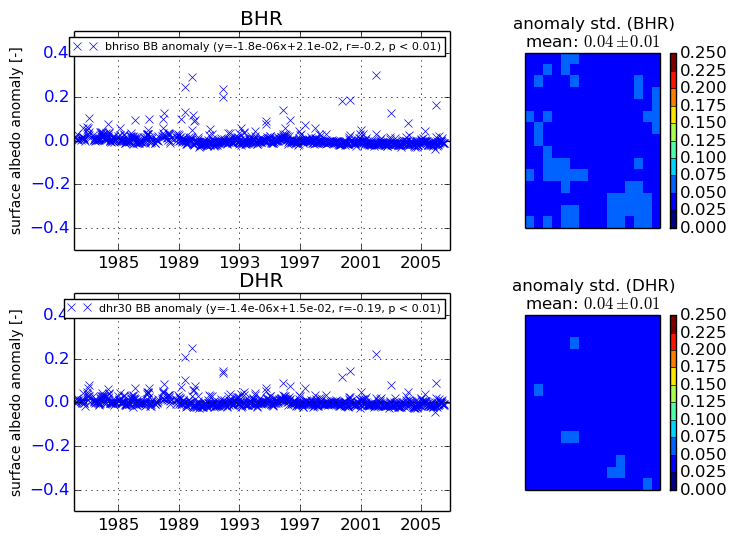
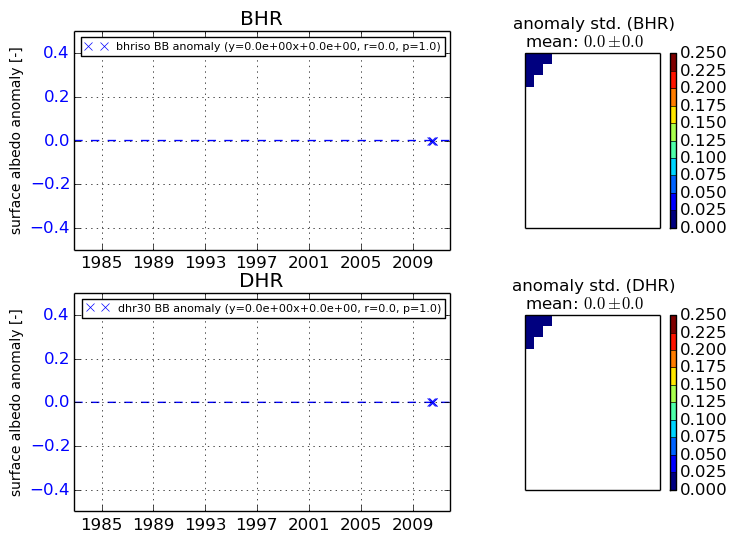
+000 deg


+057/+063 deg