DIRECT_00101


Location

lon / lat [deg]: 21.713 / -22.4093

Source network: DIRECT


Geostationary surface albedo (GSA) data


“+000”


“+057/+063”


Landcover information (based on ESA CCI landcover data)


Landcover fractions @ 2km distance


Landcover fractions @ 20 km distance


Legend


Distance to open water bodies [km]:

none in region

Distance to urban areas [km]:

none in region


Radius: 1 km

Number of landcover classes:

1

Dominant landcover type:

130: grassland

Fraction of dominant landcover type [%]:

100.0


Radius: 2 km

Number of landcover classes:

1

Dominant landcover type:

130: grassland

Fraction of dominant landcover type [%]:

100.0


Radius: 5 km

Number of landcover classes:

1

Dominant landcover type:

130: grassland

Fraction of dominant landcover type [%]:

100.0


Radius: 10 km

Number of landcover classes:

1

Dominant landcover type:

130: grassland

Fraction of dominant landcover type [%]:

100.0


Radius: 20 km

Number of landcover classes:

1

Dominant landcover type:

130: grassland

Fraction of dominant landcover type [%]:

100.0


Disturbances


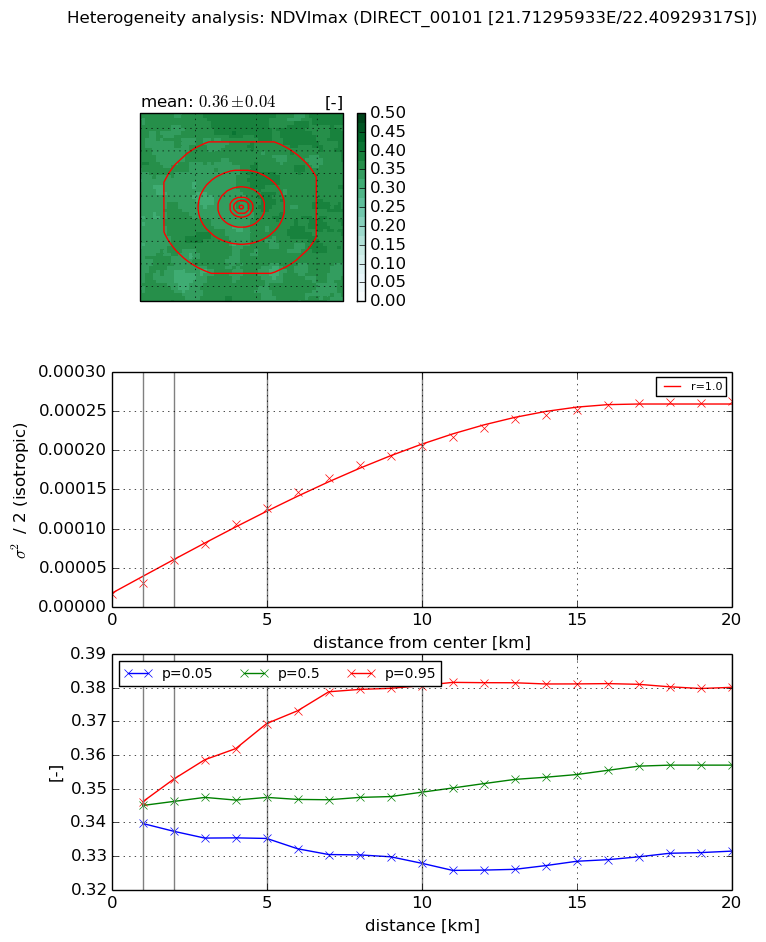
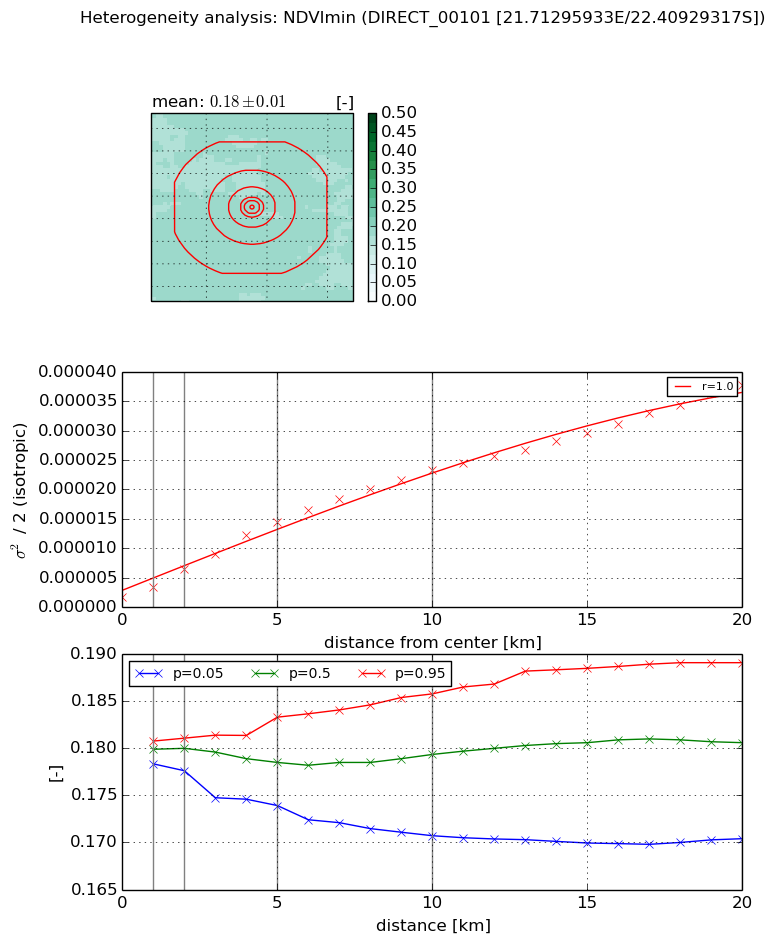
Heterogeneity analysis

The heterogeneity analysis provides information about the spatial and temporal heterogeneity of the site.

Topography


Roman et al. (2009) index


St

3.19070742299

Rcv

0.0644512196745

Rse

0.0

Rst

-0.0533033152568

Rsv

0.822475828524


Height range @ 1km [m]

17

Height range @ 2km [m]

18

Height range @ 5km [m]

21

Height range @ 10km [m]

-999

Height range @ 20km [m]

-999


Variance slope @ 1 km

14

Variance slope @ 2 km

16

Variance slope @ 5 km

11

Variance slope @ 10 km

-999

Variance slope @ 20 km

-999


NDVI (max. NDVI composite)


Roman et al. (2009) index


St

0.0284129237445

Rcv

0.421212934509

Rse

0.0

Rst

3.8327507019e-05

Rsv

105.164503551


NDVI range @ 1km [-]

0.01

NDVI range @ 2km [-]

0.02

NDVI range @ 5km [-]

0.03

NDVI range @ 10km [-]

0.05

NDVI range @ 20km [-]

0.05


Variance slope @ 1 km

1.42307549285e-05

Variance slope @ 2 km

2.12462080242e-05

Variance slope @ 5 km

2.26167689679e-05

Variance slope @ 10 km

1.96719303682e-05

Variance slope @ 20 km

1.25336144009e-05


NDVI (min. NDVI composite)I


Roman et al. (2009) index


St

1.77319492226

Rcv

0.385013389302

Rse

0.0

Rst

-0.306848116051

Rsv

-0.99999987003


NDVI range @ 1km [-]

0.0

NDVI range @ 2km [-]

0.0

NDVI range @ 5km [-]

0.01

NDVI range @ 10km [-]

0.02

NDVI range @ 20km [-]

0.02


NDVI slope @ 1 km

1.58816556082e-06

NDVI slope @ 2 km

2.37149794364e-06

NDVI slope @ 5 km

2.62821481461e-06

NDVI slope @ 10 km

2.22220395838e-06

NDVI slope @ 20 km

1.71787124004e-06


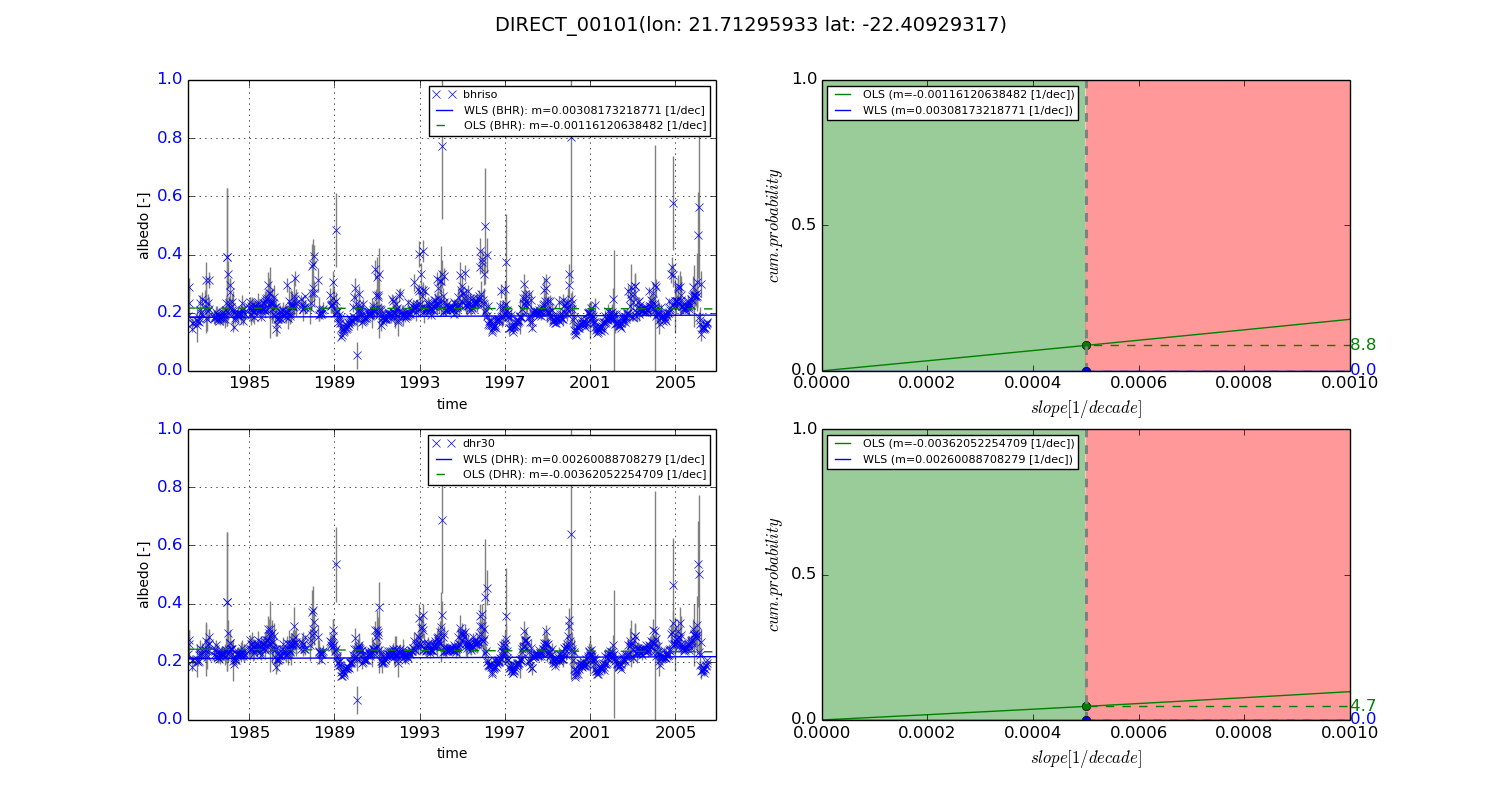
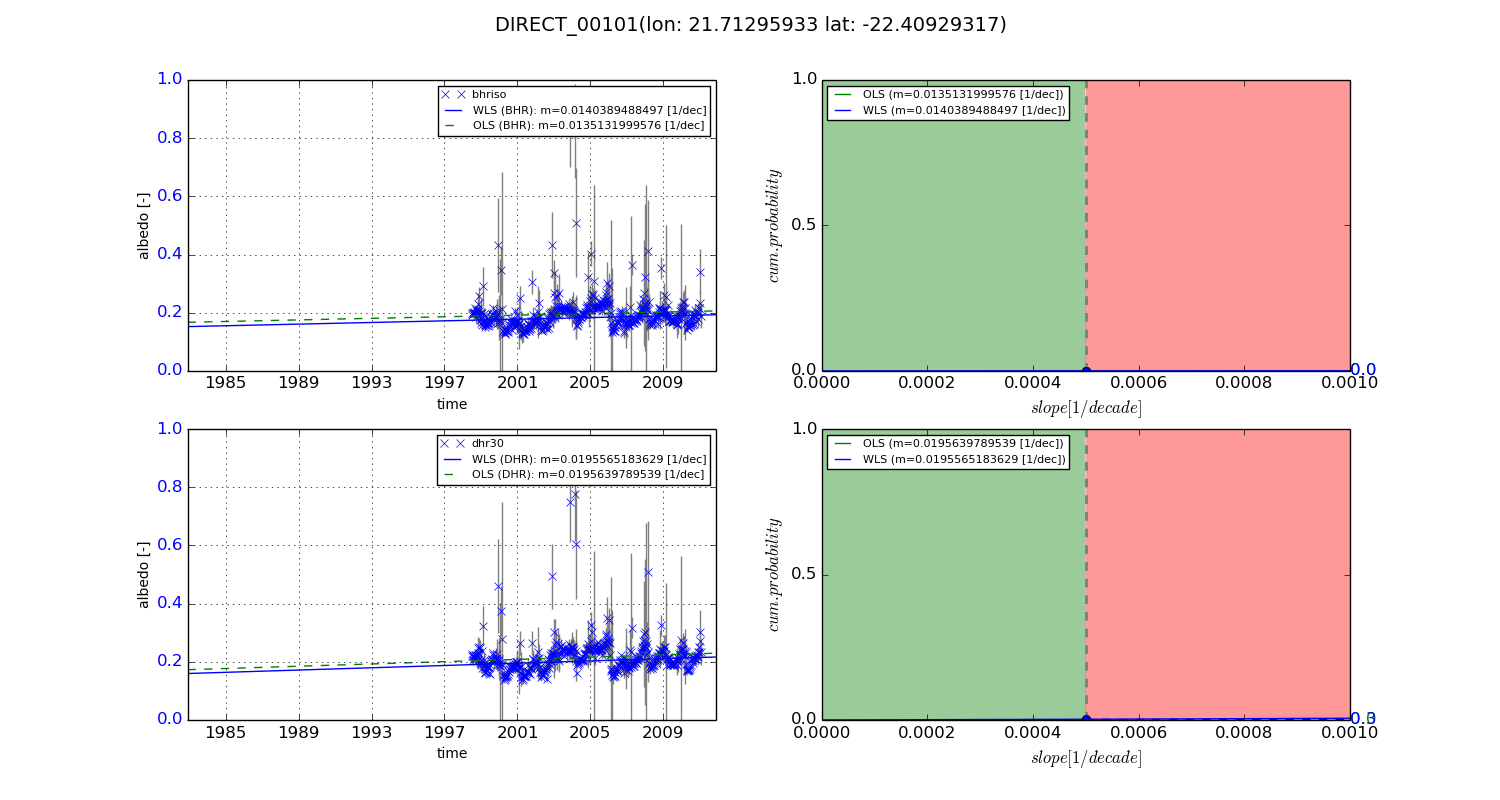
Temporal stability analysis

+000 deg (BHR)


BHR statistics

Temporal stability [1/decade]:


abs

rel


Weighted least square:

0.00308173218771


Ordinary least square:

-0.00116120638482


Probabilities that GCOS criteria is met:

Weighted least square:

0.0 %

Ordinary least square:

8.8 %


DHR statistics

Temporal stability [1/decade]:


abs

rel


Weighted least square:

0.00260088708279


Ordinary least square:

-0.00362052254709


Probabilities that GCOS criteria is met:

Weighted least square:

0.0 %

Ordinary least square:

4.7 %


+057/+063 deg (BHR)


BHR statistics

Temporal stability [1/decade]:


abs

rel


Weighted least square:

0.0140389488497


Ordinary least square:

0.0135131999576


Probabilities that GCOS criteria is met:

Weighted least square:

0.0 %

Ordinary least square:

0.0 %


DHR statistics

Temporal stability [1/decade]:


abs

rel


Weighted least square:

0.0195565183629


Ordinary least square:

0.0195639789539


Probabilities that GCOS criteria is met:

Weighted least square:

0.3 %

Ordinary least square:

0.0 %


Temporal anomaly analyis

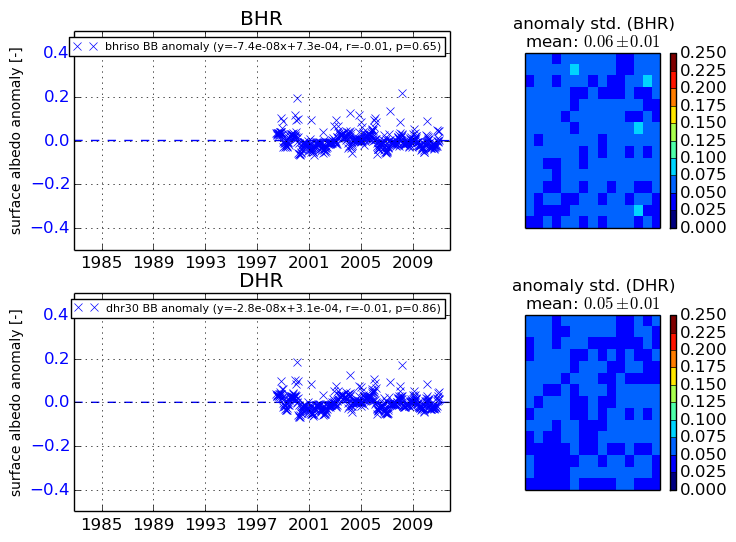
The variance of the temporal anomalies provides an additional measure about the stability of the signal AFTER removal of the mean seasonal cylce.
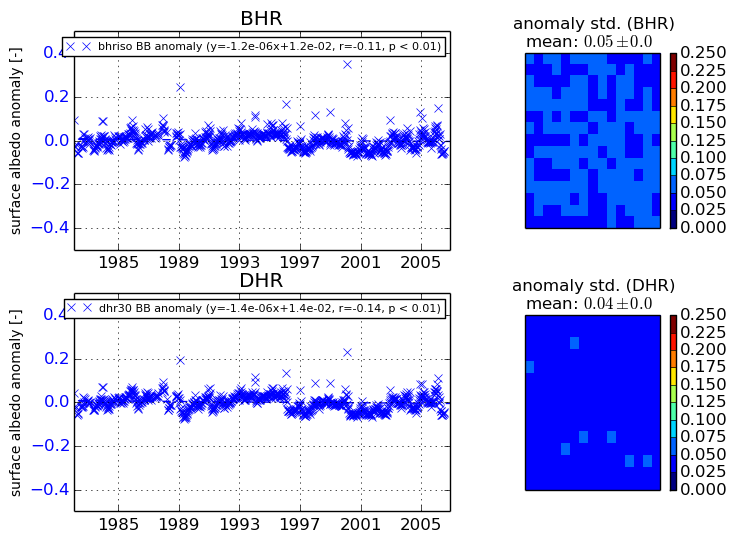
+000 deg


+057/+063 deg