DIRECT_00102


Location

lon / lat [deg]: 21.8929 / -24.1641

Source network: DIRECT


Geostationary surface albedo (GSA) data


“+000”


“+057/+063”


Landcover information (based on ESA CCI landcover data)


Landcover fractions @ 2km distance


Landcover fractions @ 20 km distance


Legend


Distance to open water bodies [km]:

14.66

Distance to urban areas [km]:

26.93


Radius: 1 km

Number of landcover classes:

1

Dominant landcover type:

130: grassland

Fraction of dominant landcover type [%]:

100.0


Radius: 2 km

Number of landcover classes:

1

Dominant landcover type:

130: grassland

Fraction of dominant landcover type [%]:

100.0


Radius: 5 km

Number of landcover classes:

1

Dominant landcover type:

130: grassland

Fraction of dominant landcover type [%]:

100.0


Radius: 10 km

Number of landcover classes:

1

Dominant landcover type:

130: grassland

Fraction of dominant landcover type [%]:

100.0


Radius: 20 km

Number of landcover classes:

1

Dominant landcover type:

130: grassland

Fraction of dominant landcover type [%]:

99.0


Disturbances


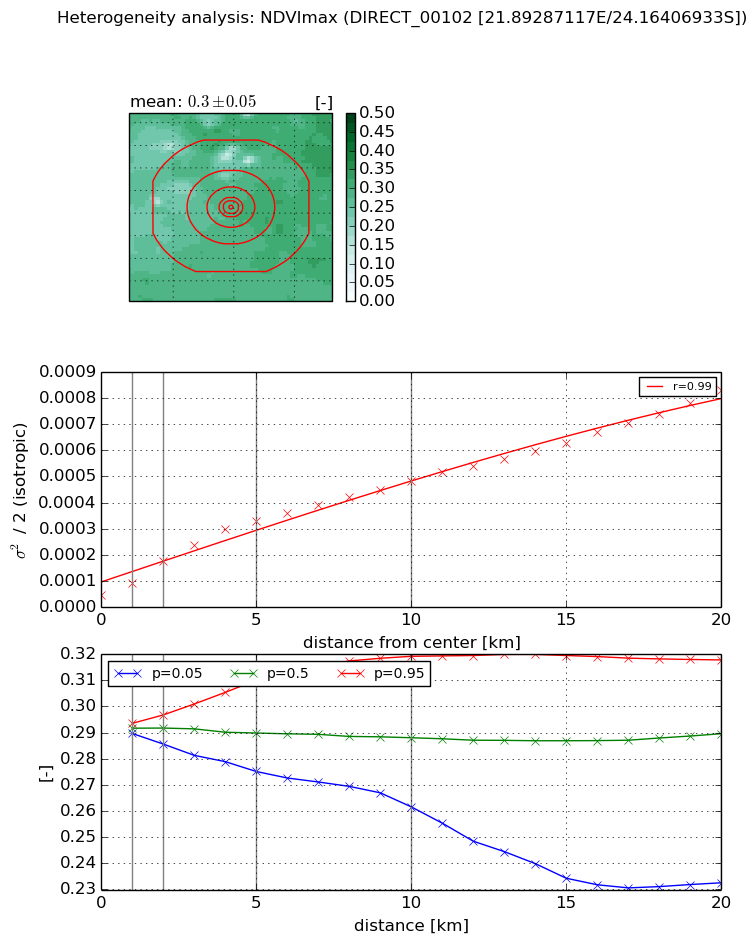
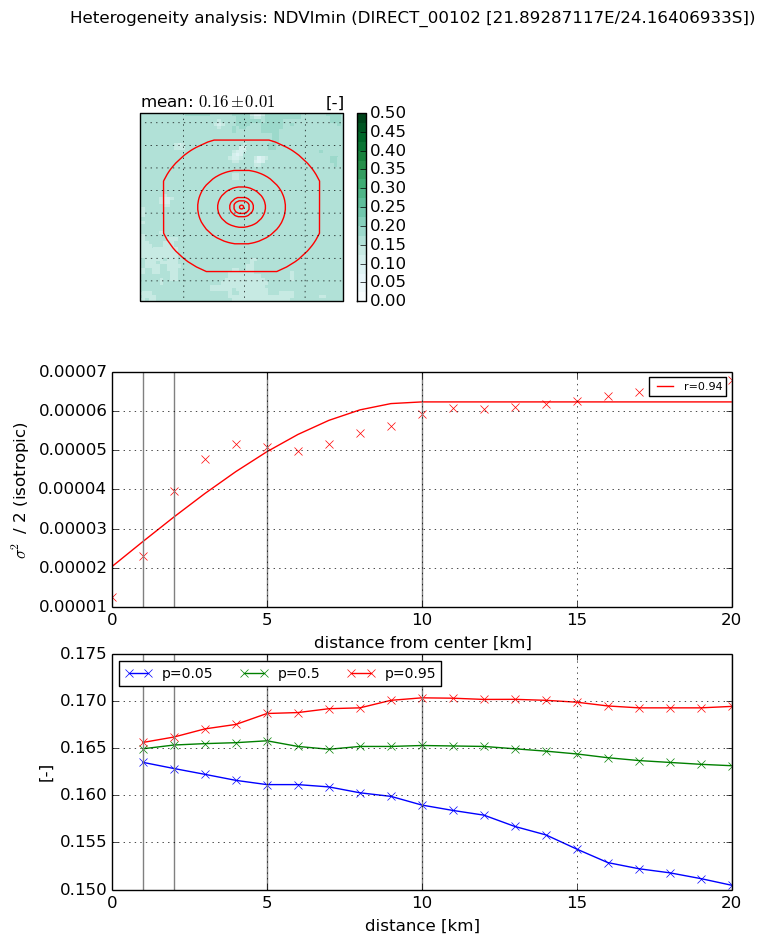
Heterogeneity analysis

The heterogeneity analysis provides information about the spatial and temporal heterogeneity of the site.

Topography


Roman et al. (2009) index


St

3.75173971026

Rcv

0.36321533808

Rse

0.0

Rst

1.8727694921e-09

Rsv

0.436413693958


Height range @ 1km [m]

3

Height range @ 2km [m]

4

Height range @ 5km [m]

6

Height range @ 10km [m]

-999

Height range @ 20km [m]

-999


Variance slope @ 1 km

0

Variance slope @ 2 km

0

Variance slope @ 5 km

0

Variance slope @ 10 km

-999

Variance slope @ 20 km

-999


NDVI (max. NDVI composite)


Roman et al. (2009) index


St

3.86447951085e-06

Rcv

0.736223113476

Rse

0.0

Rst

0.0759153788632

Rsv

776300.366735


NDVI range @ 1km [-]

0.0

NDVI range @ 2km [-]

0.01

NDVI range @ 5km [-]

0.03

NDVI range @ 10km [-]

0.06

NDVI range @ 20km [-]

0.09


Variance slope @ 1 km

4.53237987741e-05

Variance slope @ 2 km

6.42668886909e-05

Variance slope @ 5 km

5.99012466133e-05

Variance slope @ 10 km

4.29175578979e-05

Variance slope @ 20 km

3.54694335977e-05


NDVI (min. NDVI composite)I


Roman et al. (2009) index


St

1.4737056213e-05

Rcv

0.363544406396

Rse

0.0

Rst

0.175247744723

Rsv

203567.932185


NDVI range @ 1km [-]

0.0

NDVI range @ 2km [-]

0.0

NDVI range @ 5km [-]

0.01

NDVI range @ 10km [-]

0.01

NDVI range @ 20km [-]

0.02


NDVI slope @ 1 km

1.06380441231e-05

NDVI slope @ 2 km

1.35237403977e-05

NDVI slope @ 5 km

8.14888567645e-06

NDVI slope @ 10 km

3.79284455253e-06

NDVI slope @ 20 km

1.95360601559e-06


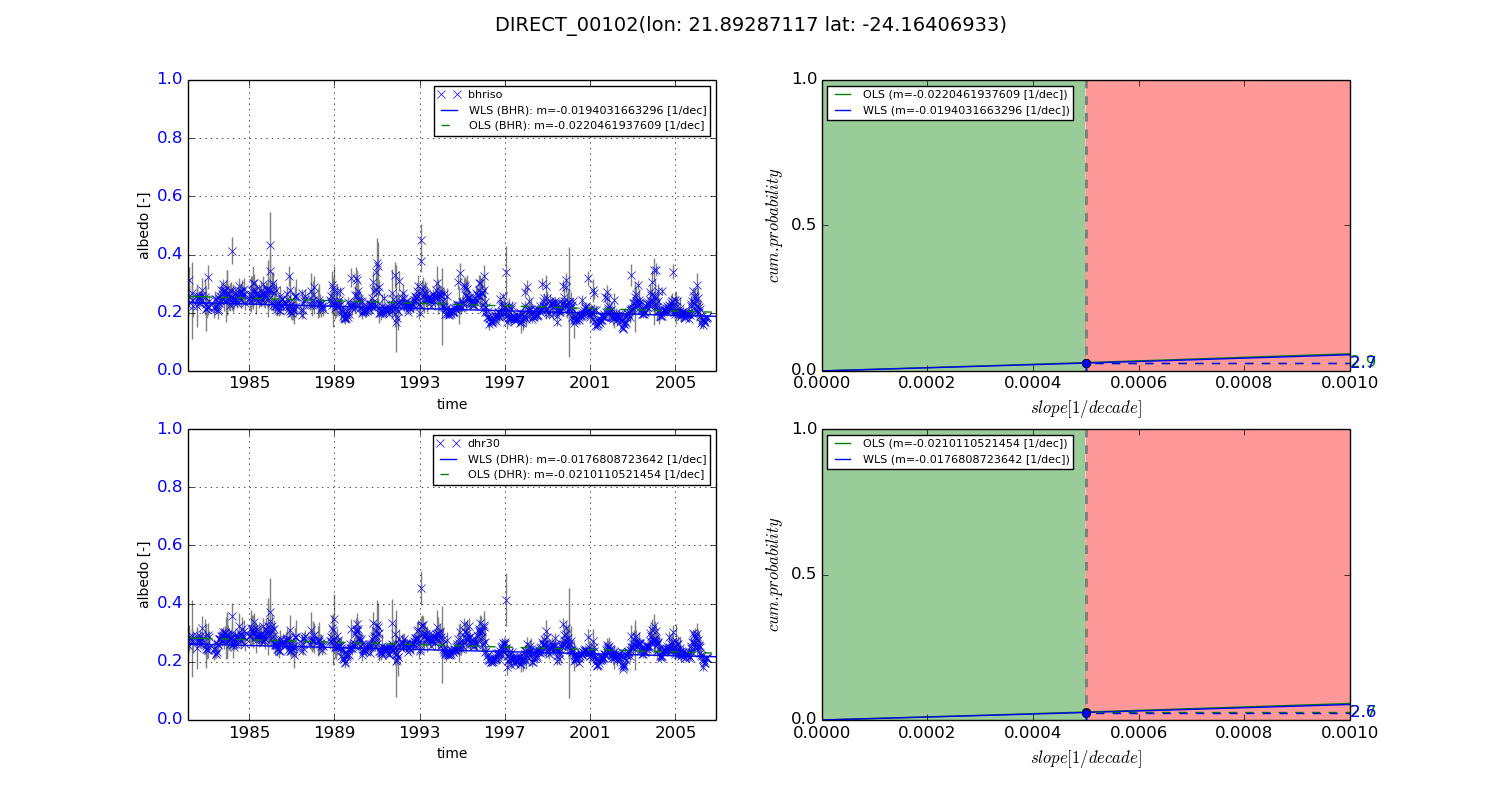
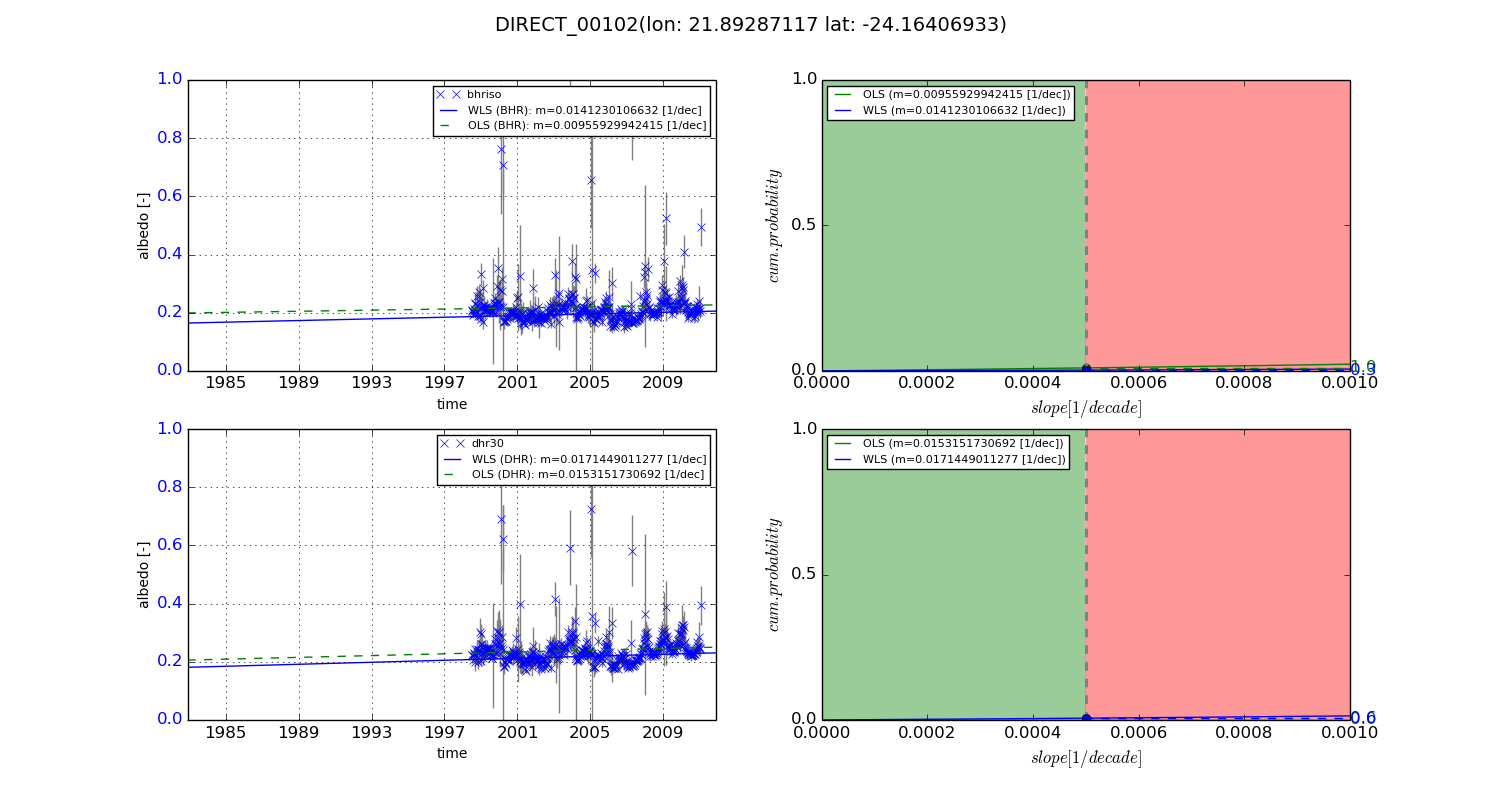
Temporal stability analysis

+000 deg (BHR)


BHR statistics

Temporal stability [1/decade]:


abs

rel


Weighted least square:

-0.0194031663296


Ordinary least square:

-0.0220461937609


Probabilities that GCOS criteria is met:

Weighted least square:

2.7 %

Ordinary least square:

2.9 %


DHR statistics

Temporal stability [1/decade]:


abs

rel


Weighted least square:

-0.0176808723642


Ordinary least square:

-0.0210110521454


Probabilities that GCOS criteria is met:

Weighted least square:

2.6 %

Ordinary least square:

2.7 %


+057/+063 deg (BHR)


BHR statistics

Temporal stability [1/decade]:


abs

rel


Weighted least square:

0.0141230106632


Ordinary least square:

0.00955929942415


Probabilities that GCOS criteria is met:

Weighted least square:

0.3 %

Ordinary least square:

1.0 %


DHR statistics

Temporal stability [1/decade]:


abs

rel


Weighted least square:

0.0171449011277


Ordinary least square:

0.0153151730692


Probabilities that GCOS criteria is met:

Weighted least square:

0.6 %

Ordinary least square:

0.0 %


Temporal anomaly analyis

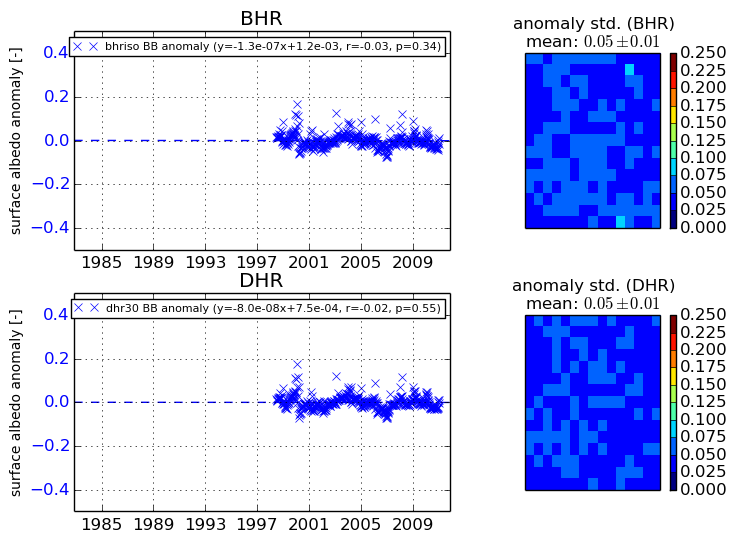
The variance of the temporal anomalies provides an additional measure about the stability of the signal AFTER removal of the mean seasonal cylce.
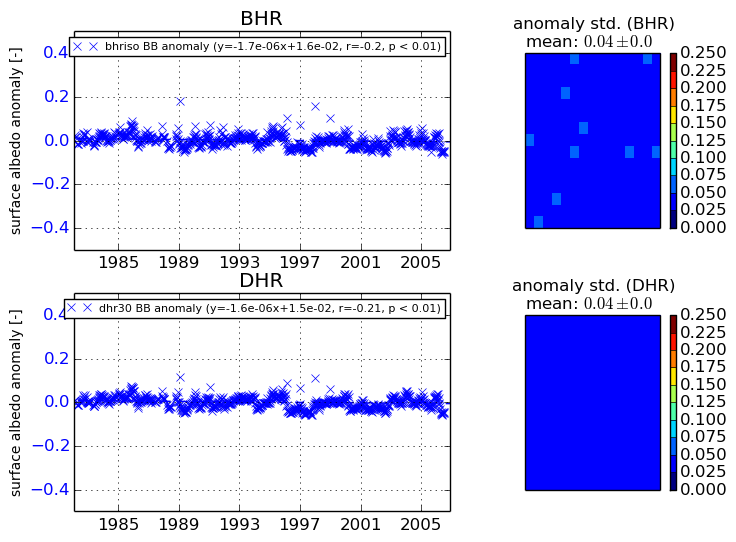
+000 deg


+057/+063 deg