DIRECT_00103


Location

lon / lat [deg]: 23.2527 / -15.4379

Source network: DIRECT


Geostationary surface albedo (GSA) data


“+000”


“+057/+063”


Landcover information (based on ESA CCI landcover data)


Landcover fractions @ 2km distance


Landcover fractions @ 20 km distance


Legend


Distance to open water bodies [km]:

3.52

Distance to urban areas [km]:

2.27


Radius: 1 km

Number of landcover classes:

4

Dominant landcover type:

20: cropland, irrigated or post-flooded

Fraction of dominant landcover type [%]:

51.0


Radius: 2 km

Number of landcover classes:

6

Dominant landcover type:

20: cropland, irrigated or post-flooded

Fraction of dominant landcover type [%]:

37.0


Radius: 5 km

Number of landcover classes:

7

Dominant landcover type:

20: cropland, irrigated or post-flooded

Fraction of dominant landcover type [%]:

33.0


Radius: 10 km

Number of landcover classes:

11

Dominant landcover type:

20: cropland, irrigated or post-flooded

Fraction of dominant landcover type [%]:

29.0


Radius: 20 km

Number of landcover classes:

9

Dominant landcover type:

20: cropland, irrigated or post-flooded

Fraction of dominant landcover type [%]:

22.0


Disturbances


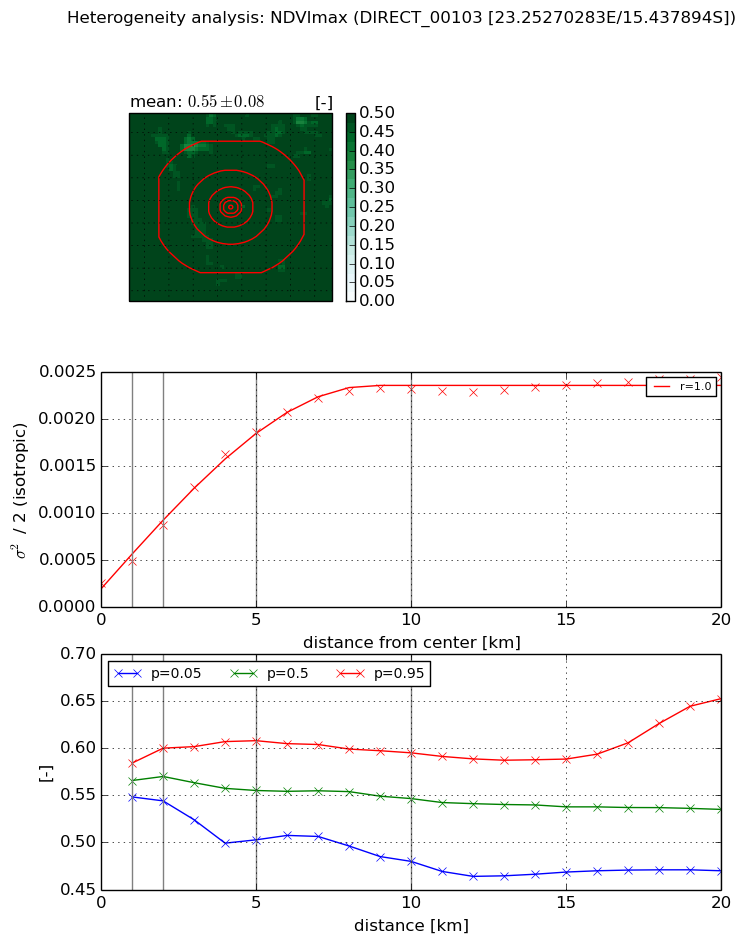
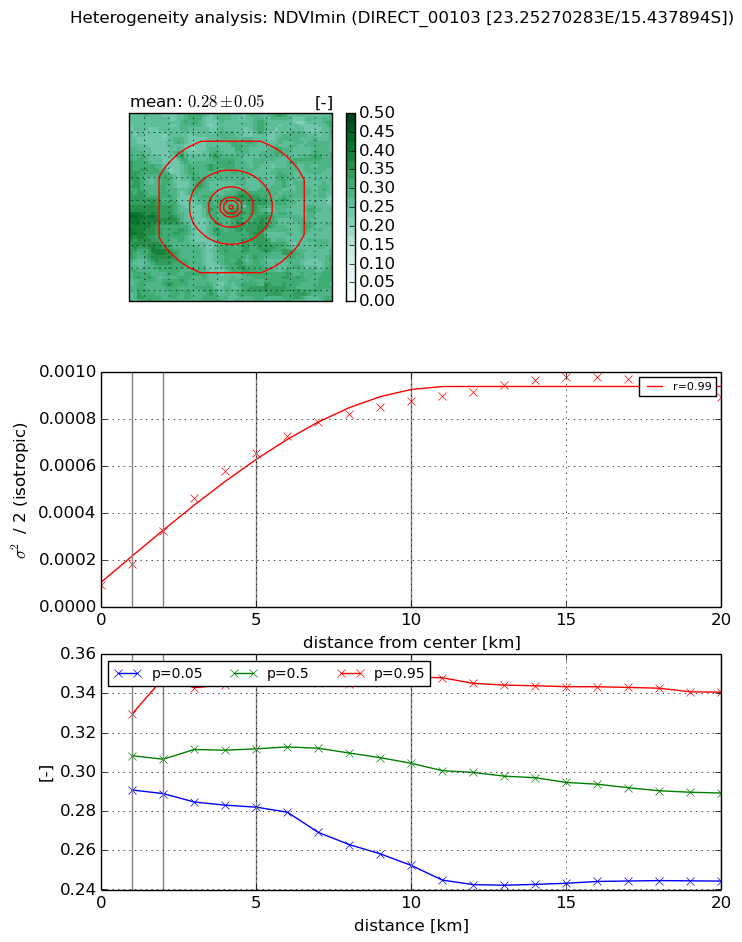
Heterogeneity analysis

The heterogeneity analysis provides information about the spatial and temporal heterogeneity of the site.

Topography


Roman et al. (2009) index


St

1.74133176915

Rcv

0.593415994421

Rse

0.0

Rst

-0.100848260255

Rsv

1.02855505704


Height range @ 1km [m]

20

Height range @ 2km [m]

27

Height range @ 5km [m]

47

Height range @ 10km [m]

-999

Height range @ 20km [m]

-999


Variance slope @ 1 km

105

Variance slope @ 2 km

109

Variance slope @ 5 km

82

Variance slope @ 10 km

-999

Variance slope @ 20 km

-999


NDVI (max. NDVI composite)


Roman et al. (2009) index


St

nan

Rcv

nan

Rse

nan

Rst

nan

Rsv

nan


NDVI range @ 1km [-]

0.04

NDVI range @ 2km [-]

0.06

NDVI range @ 5km [-]

0.11

NDVI range @ 10km [-]

0.12

NDVI range @ 20km [-]

0.18


Variance slope @ 1 km

0.00023096372019

Variance slope @ 2 km

0.000309138954635

Variance slope @ 5 km

0.000336905777368

Variance slope @ 10 km

0.000220196538194

Variance slope @ 20 km

8.79881998184e-05


NDVI (min. NDVI composite)I


Roman et al. (2009) index


St

nan

Rcv

nan

Rse

nan

Rst

nan

Rsv

nan


NDVI range @ 1km [-]

0.04

NDVI range @ 2km [-]

0.06

NDVI range @ 5km [-]

0.07

NDVI range @ 10km [-]

0.1

NDVI range @ 20km [-]

0.1


NDVI slope @ 1 km

8.50590381351e-05

NDVI slope @ 2 km

0.000113014373416

NDVI slope @ 5 km

0.00011774460963

NDVI slope @ 10 km

8.07185229724e-05

NDVI slope @ 20 km

3.77363205929e-05


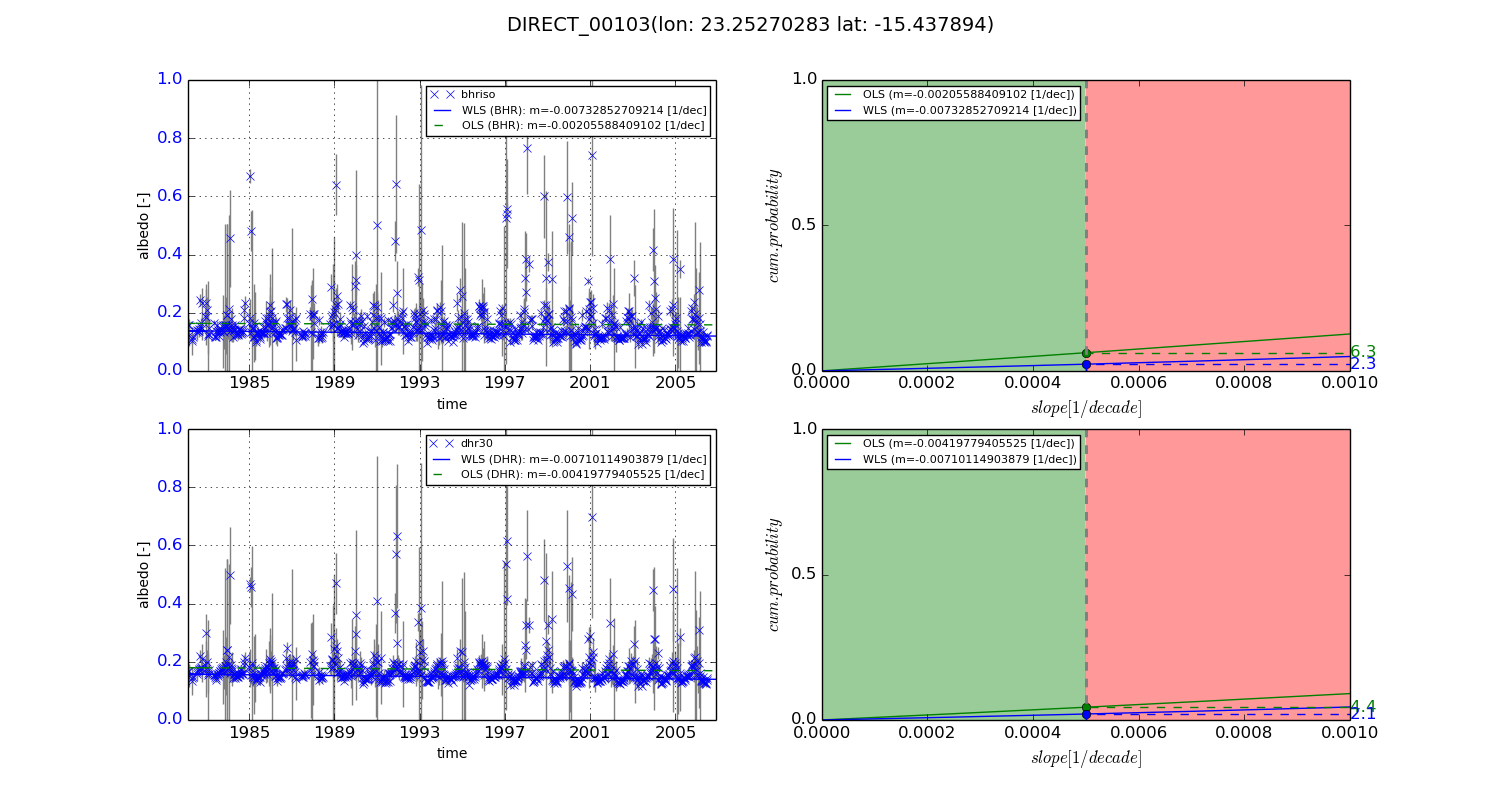
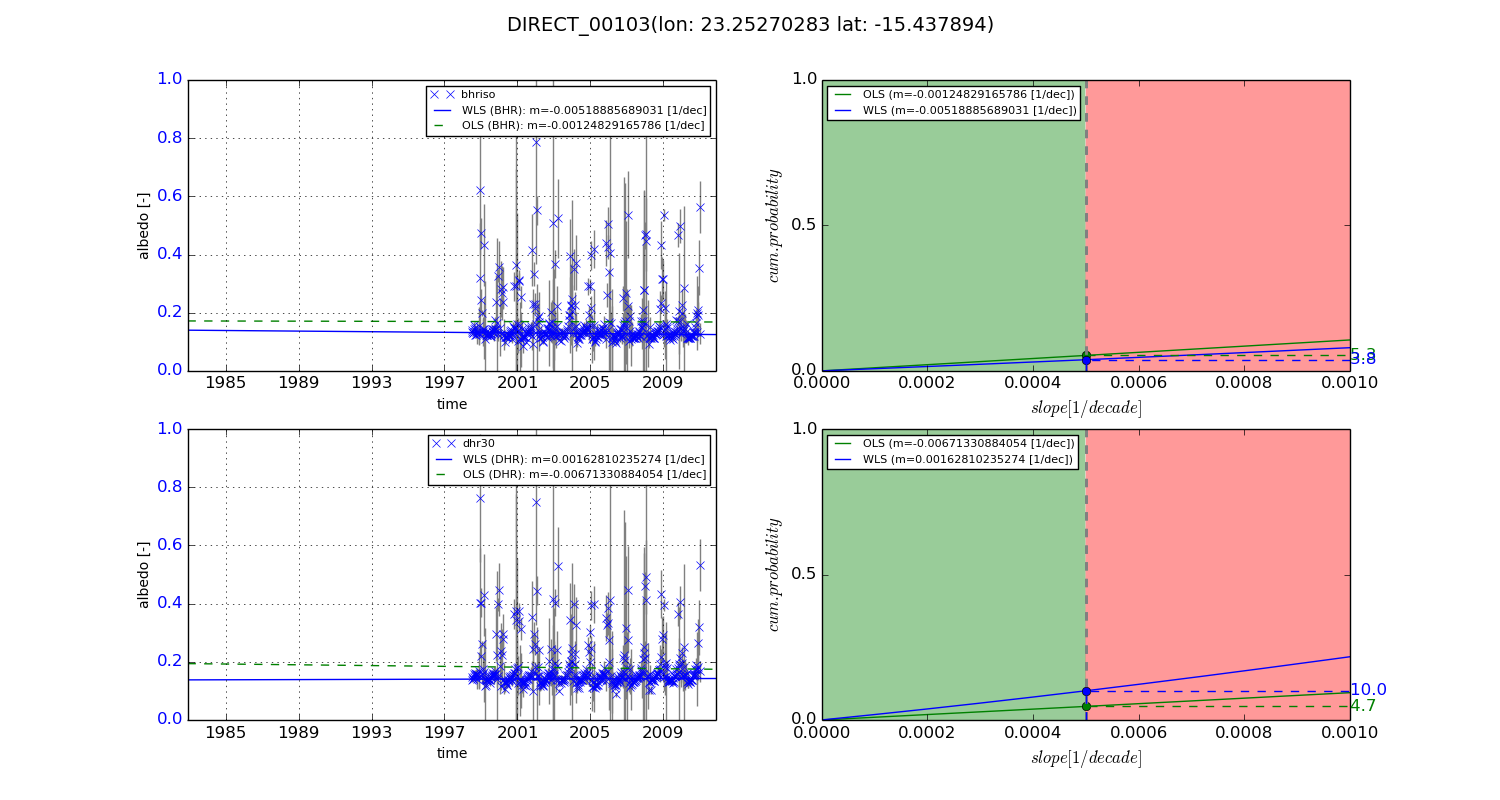
Temporal stability analysis

+000 deg (BHR)


BHR statistics

Temporal stability [1/decade]:


abs

rel


Weighted least square:

-0.00732852709214


Ordinary least square:

-0.00205588409102


Probabilities that GCOS criteria is met:

Weighted least square:

2.3 %

Ordinary least square:

6.3 %


DHR statistics

Temporal stability [1/decade]:


abs

rel


Weighted least square:

-0.00710114903879


Ordinary least square:

-0.00419779405525


Probabilities that GCOS criteria is met:

Weighted least square:

2.1 %

Ordinary least square:

4.4 %


+057/+063 deg (BHR)


BHR statistics

Temporal stability [1/decade]:


abs

rel


Weighted least square:

-0.00518885689031


Ordinary least square:

-0.00124829165786


Probabilities that GCOS criteria is met:

Weighted least square:

3.8 %

Ordinary least square:

5.3 %


DHR statistics

Temporal stability [1/decade]:


abs

rel


Weighted least square:

0.00162810235274


Ordinary least square:

-0.00671330884054


Probabilities that GCOS criteria is met:

Weighted least square:

10.0 %

Ordinary least square:

4.7 %


Temporal anomaly analyis

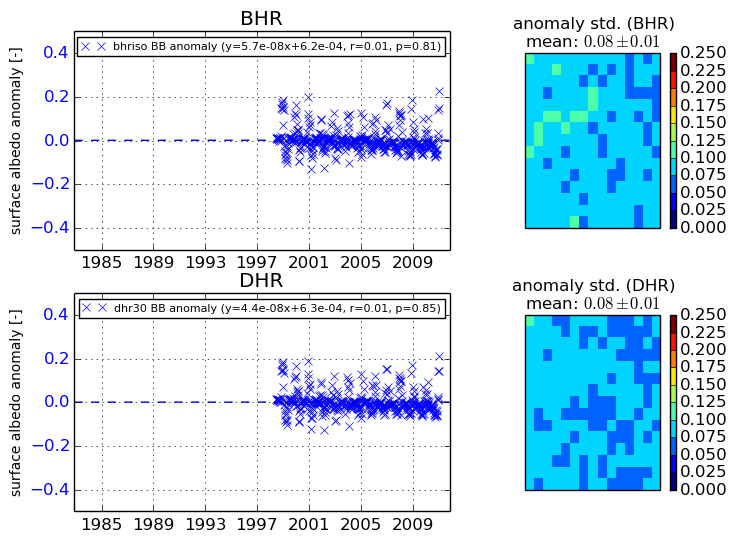
The variance of the temporal anomalies provides an additional measure about the stability of the signal AFTER removal of the mean seasonal cylce.
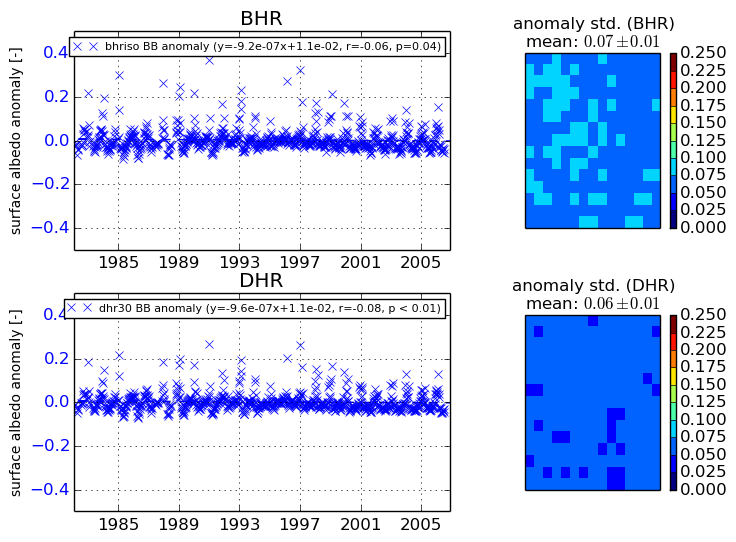
+000 deg


+057/+063 deg