DIRECT_00107


Location

lon / lat [deg]: 4.6853 / 50.8372

Source network: DIRECT


Geostationary surface albedo (GSA) data


“+000”


“+057/+063”


Landcover information (based on ESA CCI landcover data)


Landcover fractions @ 2km distance


Landcover fractions @ 20 km distance


Legend


Distance to open water bodies [km]:

1.73

Distance to urban areas [km]:

0.8


Radius: 1 km

Number of landcover classes:

5

Dominant landcover type:

90: Tree cover, mixed leaf type

Fraction of dominant landcover type [%]:

61.0


Radius: 2 km

Number of landcover classes:

6

Dominant landcover type:

190: urban areas

Fraction of dominant landcover type [%]:

44.0


Radius: 5 km

Number of landcover classes:

8

Dominant landcover type:

190: urban areas

Fraction of dominant landcover type [%]:

47.0


Radius: 10 km

Number of landcover classes:

7

Dominant landcover type:

10: cropland, rainfed

Fraction of dominant landcover type [%]:

46.0


Radius: 20 km

Number of landcover classes:

5

Dominant landcover type:

190: urban areas

Fraction of dominant landcover type [%]:

47.0


Disturbances


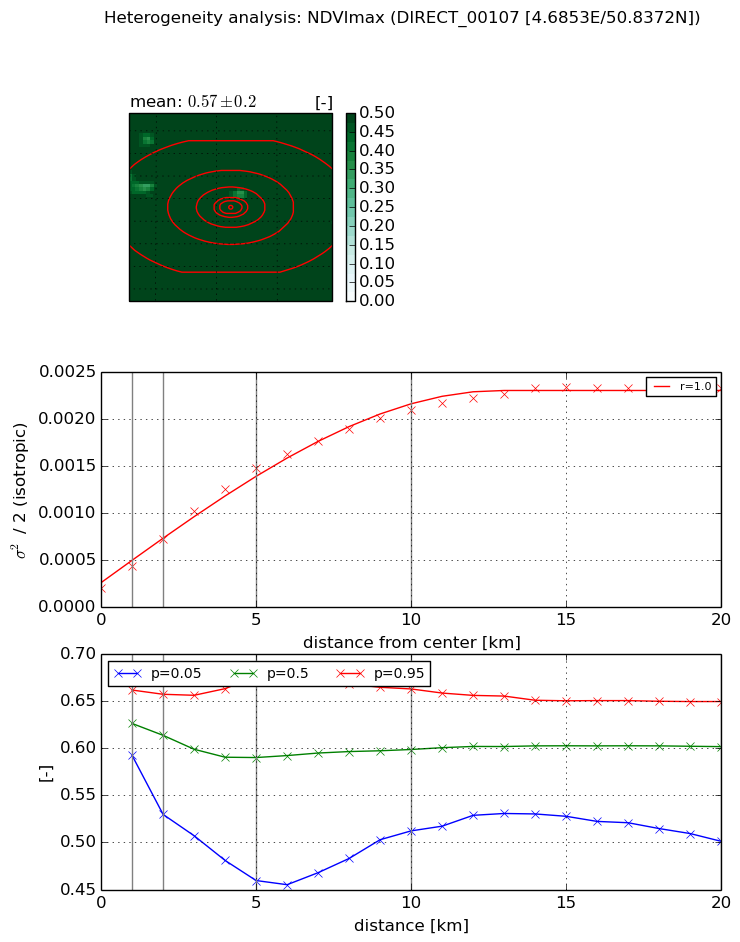
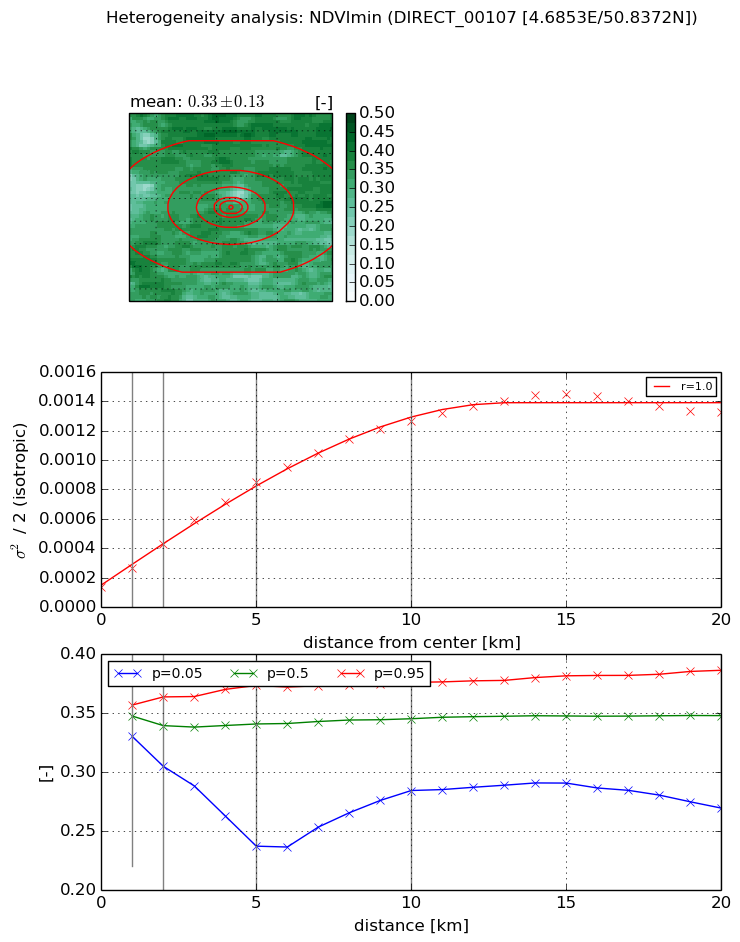
Heterogeneity analysis

The heterogeneity analysis provides information about the spatial and temporal heterogeneity of the site.

Topography


Roman et al. (2009) index


St

2.65419576021

Rcv

0.168259794389

Rse

0.0

Rst

-6.64736408925e-06

Rsv

-0.962019441818


Height range @ 1km [m]

19

Height range @ 2km [m]

41

Height range @ 5km [m]

72

Height range @ 10km [m]

-999

Height range @ 20km [m]

-999


Variance slope @ 1 km

151

Variance slope @ 2 km

137

Variance slope @ 5 km

91

Variance slope @ 10 km

-999

Variance slope @ 20 km

-999


NDVI (max. NDVI composite)


Roman et al. (2009) index


St

2.78498871318

Rcv

0.370987343169

Rse

0.0

Rst

-0.0908167506776

Rsv

0.615399553622


NDVI range @ 1km [-]

0.07

NDVI range @ 2km [-]

0.13

NDVI range @ 5km [-]

0.22

NDVI range @ 10km [-]

0.15

NDVI range @ 20km [-]

0.15


Variance slope @ 1 km

0.000224035873563

Variance slope @ 2 km

0.000257233802149

Variance slope @ 5 km

0.000259632419925

Variance slope @ 10 km

0.000191624685848

Variance slope @ 20 km

9.8664483917e-05


NDVI (min. NDVI composite)I


Roman et al. (2009) index


St

0.981835344181

Rcv

0.595100012495

Rse

0.0

Rst

0.0711649707509

Rsv

2.38923716157


NDVI range @ 1km [-]

0.03

NDVI range @ 2km [-]

0.06

NDVI range @ 5km [-]

0.14

NDVI range @ 10km [-]

0.09

NDVI range @ 20km [-]

0.12


NDVI slope @ 1 km

0.000134516477574

NDVI slope @ 2 km

0.000148532933643

NDVI slope @ 5 km

0.00014475749052

NDVI slope @ 10 km

0.000115643159

NDVI slope @ 20 km

5.91439601179e-05


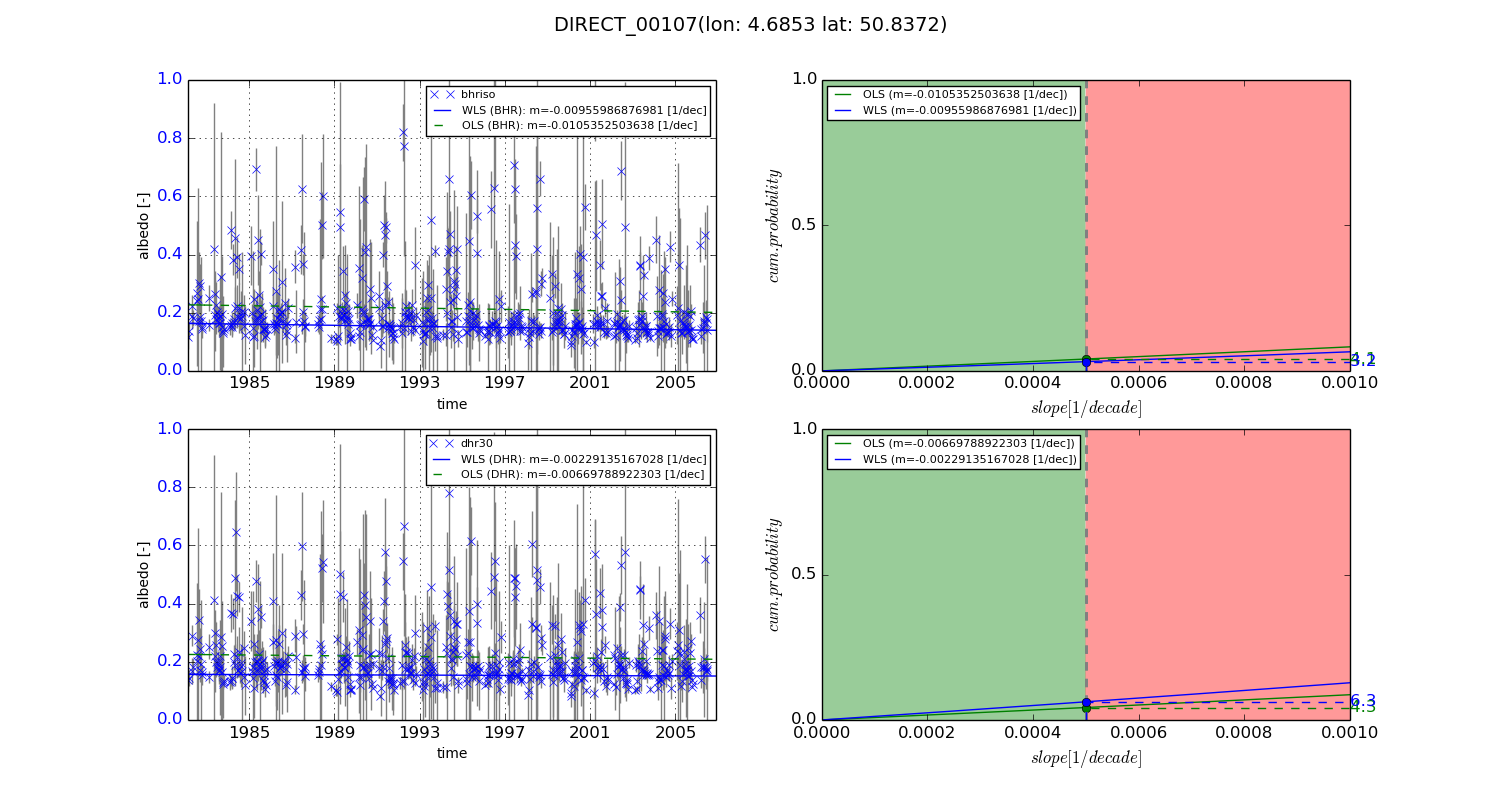
Temporal stability analysis

+000 deg (BHR)


BHR statistics

Temporal stability [1/decade]:


abs

rel


Weighted least square:

-0.00955986876981


Ordinary least square:

-0.0105352503638


Probabilities that GCOS criteria is met:

Weighted least square:

3.2 %

Ordinary least square:

4.1 %


DHR statistics

Temporal stability [1/decade]:


abs

rel


Weighted least square:

-0.00229135167028


Ordinary least square:

-0.00669788922303


Probabilities that GCOS criteria is met:

Weighted least square:

6.3 %

Ordinary least square:

4.3 %


+057/+063 deg (BHR)


BHR statistics

Temporal stability [1/decade]:


abs

rel


Weighted least square:

-99999.0


Ordinary least square:

-99999.0


Probabilities that GCOS criteria is met:

Weighted least square:

-99999.0 %

Ordinary least square:

-99999.0 %


DHR statistics

Temporal stability [1/decade]:


abs

rel


Weighted least square:

-99999.0


Ordinary least square:

-99999.0


Probabilities that GCOS criteria is met:

Weighted least square:

-99999.0 %

Ordinary least square:

-99999.0 %


Temporal anomaly analyis

The variance of the temporal anomalies provides an additional measure about the stability of the signal AFTER removal of the mean seasonal cylce.
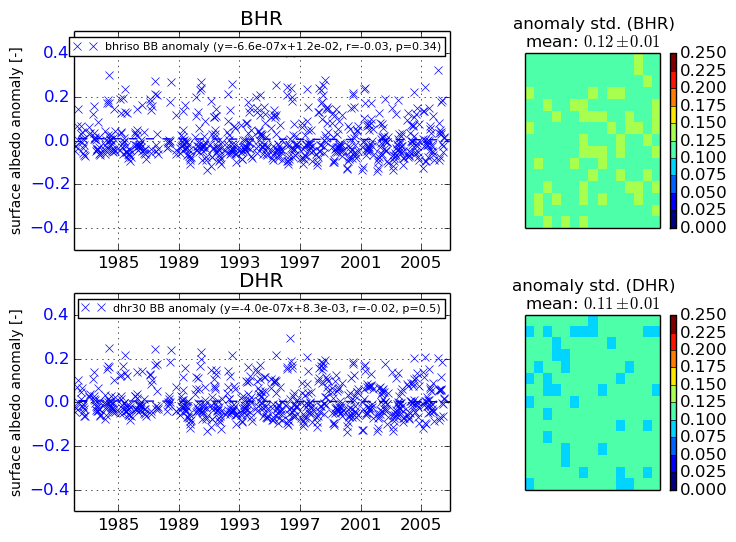
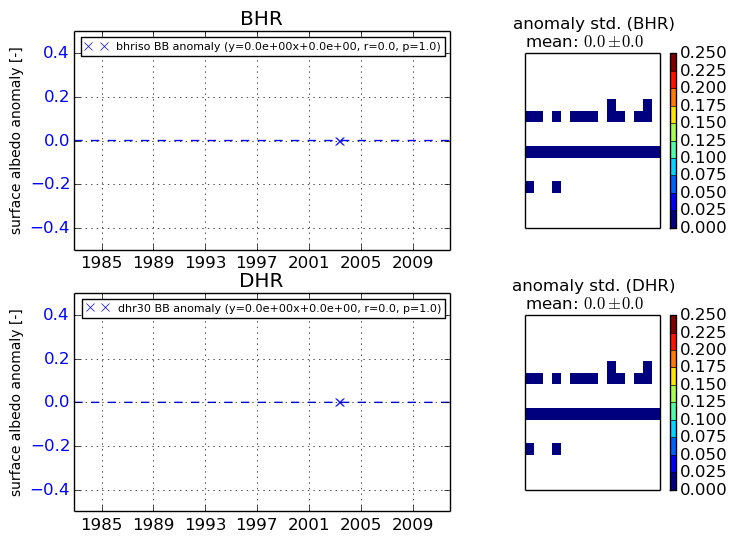
+000 deg


+057/+063 deg