DIRECT_00108


Location

lon / lat [deg]: -48.15 / -22.22

Source network: DIRECT


Geostationary surface albedo (GSA) data


“+000”


“+057/+063”


Landcover information (based on ESA CCI landcover data)


Landcover fractions @ 2km distance


Landcover fractions @ 20 km distance


Legend


Distance to open water bodies [km]:

11.73

Distance to urban areas [km]:

5.38


Radius: 1 km

Number of landcover classes:

2

Dominant landcover type:

50: Tree cover, broadleaved, evergreen, closed to open (>15%)

Fraction of dominant landcover type [%]:

88.0


Radius: 2 km

Number of landcover classes:

3

Dominant landcover type:

50: Tree cover, broadleaved, evergreen, closed to open (>15%)

Fraction of dominant landcover type [%]:

56.0


Radius: 5 km

Number of landcover classes:

5

Dominant landcover type:

10: cropland, rainfed

Fraction of dominant landcover type [%]:

76.0


Radius: 10 km

Number of landcover classes:

3

Dominant landcover type:

10: cropland, rainfed

Fraction of dominant landcover type [%]:

82.0


Radius: 20 km

Number of landcover classes:

3

Dominant landcover type:

10: cropland, rainfed

Fraction of dominant landcover type [%]:

88.0


Disturbances


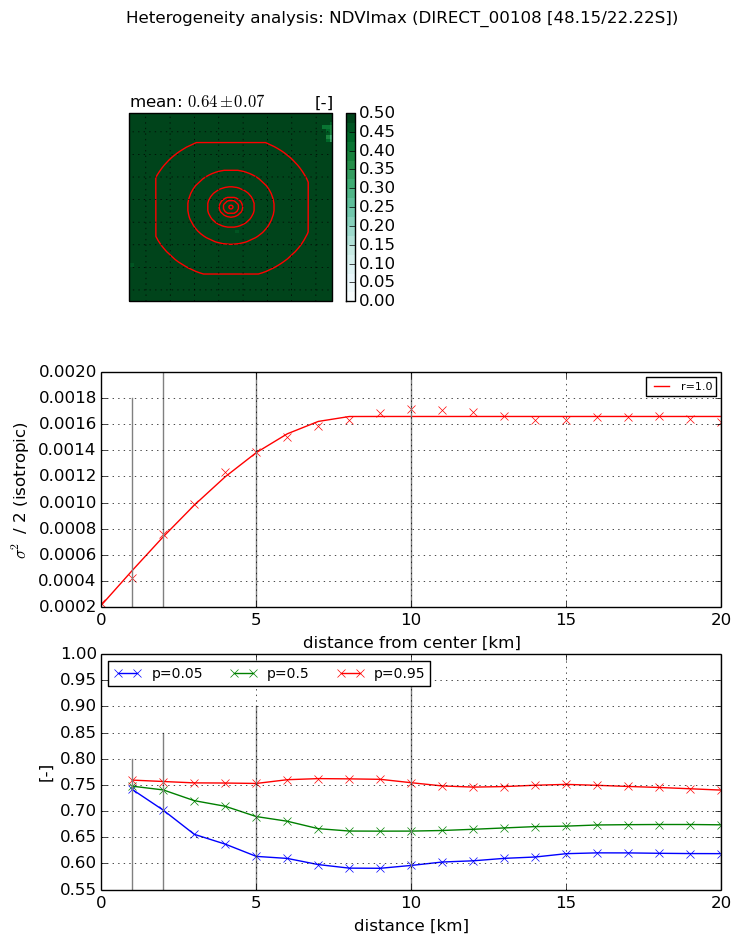
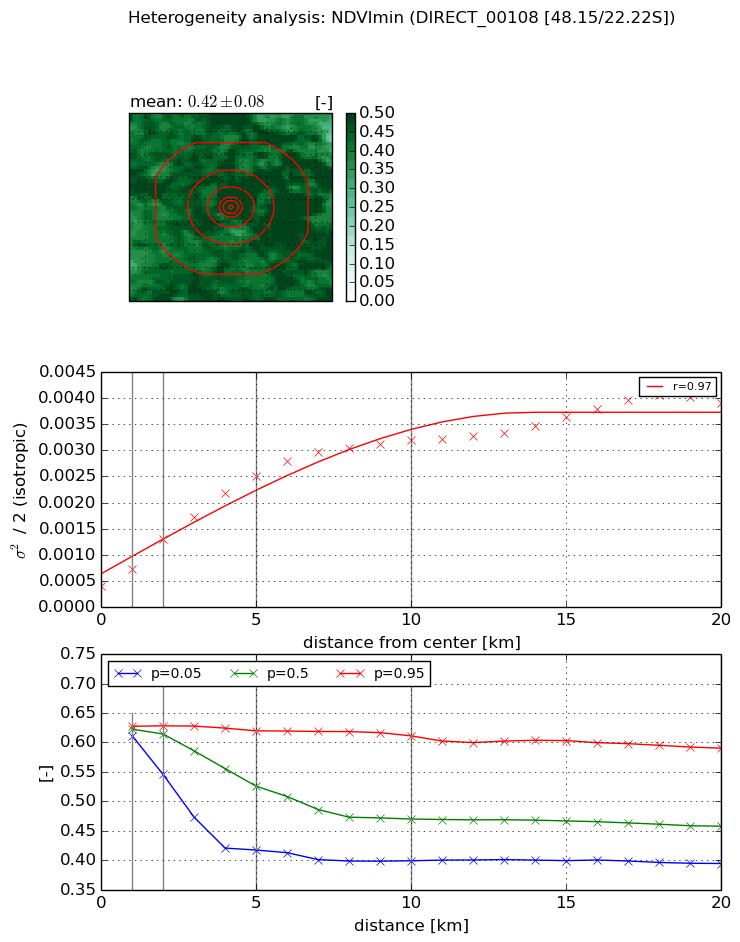
Heterogeneity analysis

The heterogeneity analysis provides information about the spatial and temporal heterogeneity of the site.

Topography


Roman et al. (2009) index


St

2.23016552148e-06

Rcv

0.25341331834

Rse

0.0

Rst

0.00590761825015

Rsv

1345191.37381


Height range @ 1km [m]

62

Height range @ 2km [m]

88

Height range @ 5km [m]

126

Height range @ 10km [m]

-999

Height range @ 20km [m]

-999


Variance slope @ 1 km

408

Variance slope @ 2 km

402

Variance slope @ 5 km

337

Variance slope @ 10 km

-999

Variance slope @ 20 km

-999


NDVI (max. NDVI composite)


Roman et al. (2009) index


St

4.26352350869

Rcv

0.45440118248

Rse

0.0

Rst

-0.0655444830383

Rsv

0.183697692819


NDVI range @ 1km [-]

0.02

NDVI range @ 2km [-]

0.05

NDVI range @ 5km [-]

0.14

NDVI range @ 10km [-]

0.16

NDVI range @ 20km [-]

0.12


Variance slope @ 1 km

0.000193646834

Variance slope @ 2 km

0.000262550405036

Variance slope @ 5 km

0.000240523045337

Variance slope @ 10 km

0.000150146412756

Variance slope @ 20 km

5.35939892352e-05


NDVI (min. NDVI composite)I


Roman et al. (2009) index


St

3.10720926264

Rcv

0.521692628194

Rse

0.0

Rst

-0.140074461682

Rsv

0.303729517022


NDVI range @ 1km [-]

0.02

NDVI range @ 2km [-]

0.08

NDVI range @ 5km [-]

0.2

NDVI range @ 10km [-]

0.21

NDVI range @ 20km [-]

0.2


NDVI slope @ 1 km

0.000335143287191

NDVI slope @ 2 km

0.000455669045633

NDVI slope @ 5 km

0.000436979466908

NDVI slope @ 10 km

0.000288561882382

NDVI slope @ 20 km

0.000158377978365


Temporal stability analysis

+000 deg (BHR)


BHR statistics

Temporal stability [1/decade]:


abs

rel


Weighted least square:

-99999.0


Ordinary least square:

-99999.0


Probabilities that GCOS criteria is met:

Weighted least square:

-99999.0 %

Ordinary least square:

-99999.0 %


DHR statistics

Temporal stability [1/decade]:


abs

rel


Weighted least square:

-99999.0


Ordinary least square:

-99999.0


Probabilities that GCOS criteria is met:

Weighted least square:

-99999.0 %

Ordinary least square:

-99999.0 %


+057/+063 deg (BHR)


BHR statistics

Temporal stability [1/decade]:


abs

rel


Weighted least square:

None


Ordinary least square:

None


Probabilities that GCOS criteria is met:

Weighted least square:

None %

Ordinary least square:

None %


DHR statistics

Temporal stability [1/decade]:


abs

rel


Weighted least square:

None


Ordinary least square:

None


Probabilities that GCOS criteria is met:

Weighted least square:

None %

Ordinary least square:

None %


Temporal anomaly analyis

The variance of the temporal anomalies provides an additional measure about the stability of the signal AFTER removal of the mean seasonal cylce.

+000 deg


+057/+063 deg