DIRECT_00109


Location

lon / lat [deg]: -46.37 / -22.35

Source network: DIRECT


Geostationary surface albedo (GSA) data


“+000”


“+057/+063”


Landcover information (based on ESA CCI landcover data)


Landcover fractions @ 2km distance


Landcover fractions @ 20 km distance


Legend


Distance to open water bodies [km]:

17.59

Distance to urban areas [km]:

5.08


Radius: 1 km

Number of landcover classes:

3

Dominant landcover type:

10: cropland, rainfed

Fraction of dominant landcover type [%]:

76.0


Radius: 2 km

Number of landcover classes:

3

Dominant landcover type:

10: cropland, rainfed

Fraction of dominant landcover type [%]:

69.0


Radius: 5 km

Number of landcover classes:

3

Dominant landcover type:

10: cropland, rainfed

Fraction of dominant landcover type [%]:

89.0


Radius: 10 km

Number of landcover classes:

3

Dominant landcover type:

10: cropland, rainfed

Fraction of dominant landcover type [%]:

88.0


Radius: 20 km

Number of landcover classes:

4

Dominant landcover type:

10: cropland, rainfed

Fraction of dominant landcover type [%]:

93.0


Disturbances


Heterogeneity analysis

The heterogeneity analysis provides information about the spatial and temporal heterogeneity of the site.

Topography


Roman et al. (2009) index


St

6.03467995139e-13

Rcv

0.18204919421

Rse

0.0

Rst

-0.0110314666744

Rsv

4.97126612209e+12


Height range @ 1km [m]

118

Height range @ 2km [m]

190

Height range @ 5km [m]

276

Height range @ 10km [m]

-999

Height range @ 20km [m]

-999


Variance slope @ 1 km

2403

Variance slope @ 2 km

1920

Variance slope @ 5 km

1568

Variance slope @ 10 km

-999

Variance slope @ 20 km

-999


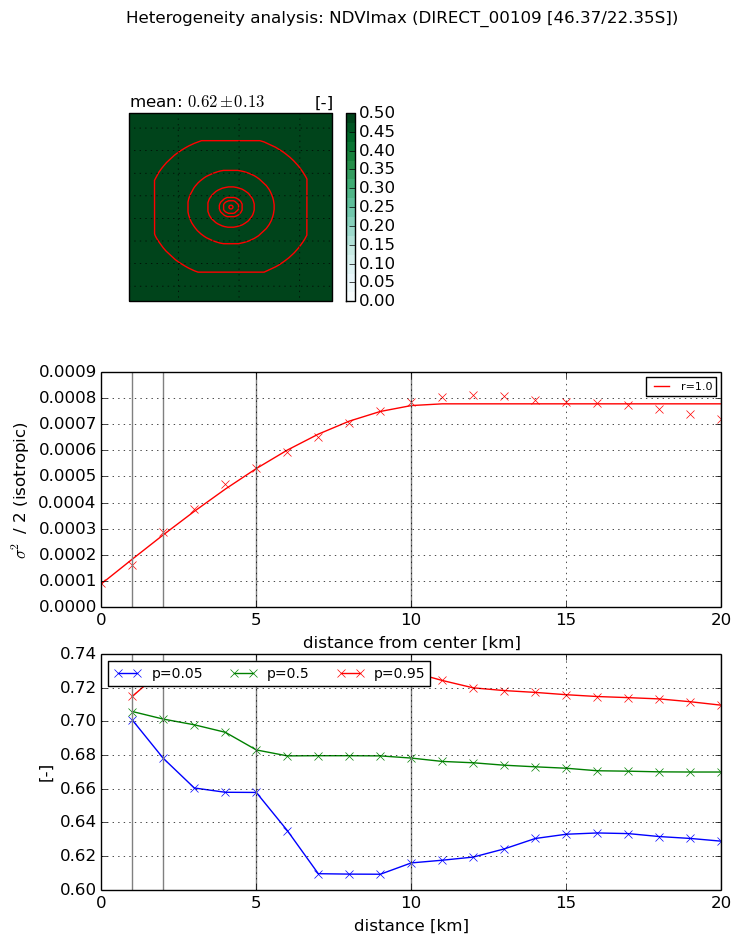
NDVI (max. NDVI composite)


Roman et al. (2009) index


St

3.3796658928

Rcv

0.118122780107

Rse

0.0

Rst

-0.158360490451

Rsv

0.611178437775


NDVI range @ 1km [-]

0.01

NDVI range @ 2km [-]

0.05

NDVI range @ 5km [-]

0.07

NDVI range @ 10km [-]

0.11

NDVI range @ 20km [-]

0.08


Variance slope @ 1 km

7.13512365453e-05

Variance slope @ 2 km

9.73922459589e-05

Variance slope @ 5 km

9.20041682575e-05

Variance slope @ 10 km

7.04128288663e-05

Variance slope @ 20 km

2.94975839264e-05


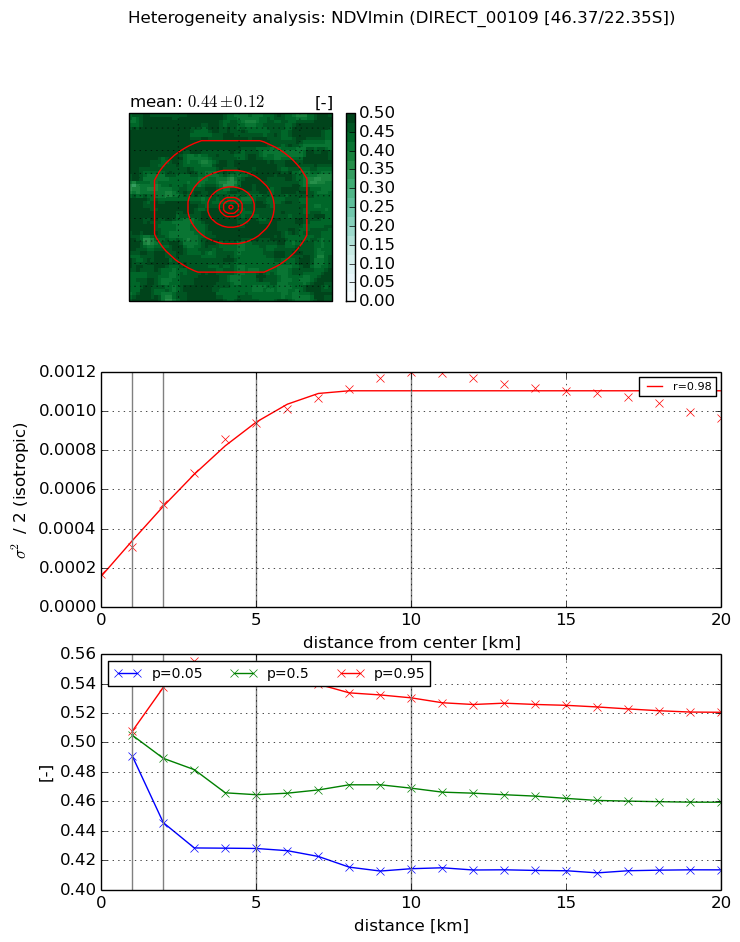
NDVI (min. NDVI composite)I


Roman et al. (2009) index


St

9.83747850777

Rcv

-0.0581731375811

Rse

0.0

Rst

-0.159941621057

Rsv

0.0868414349256


NDVI range @ 1km [-]

0.02

NDVI range @ 2km [-]

0.09

NDVI range @ 5km [-]

0.12

NDVI range @ 10km [-]

0.12

NDVI range @ 20km [-]

0.11


NDVI slope @ 1 km

0.000136447239445

NDVI slope @ 2 km

0.000179755016707

NDVI slope @ 5 km

0.000162234136046

NDVI slope @ 10 km

0.000102688059023

NDVI slope @ 20 km

3.12023396262e-05


Temporal stability analysis

+000 deg (BHR)


BHR statistics

Temporal stability [1/decade]:


abs

rel


Weighted least square:

-99999.0


Ordinary least square:

-99999.0


Probabilities that GCOS criteria is met:

Weighted least square:

-99999.0 %

Ordinary least square:

-99999.0 %


DHR statistics

Temporal stability [1/decade]:


abs

rel


Weighted least square:

-99999.0


Ordinary least square:

-99999.0


Probabilities that GCOS criteria is met:

Weighted least square:

-99999.0 %

Ordinary least square:

-99999.0 %


+057/+063 deg (BHR)


BHR statistics

Temporal stability [1/decade]:


abs

rel


Weighted least square:

None


Ordinary least square:

None


Probabilities that GCOS criteria is met:

Weighted least square:

None %

Ordinary least square:

None %


DHR statistics

Temporal stability [1/decade]:


abs

rel


Weighted least square:

None


Ordinary least square:

None


Probabilities that GCOS criteria is met:

Weighted least square:

None %

Ordinary least square:

None %


Temporal anomaly analyis

The variance of the temporal anomalies provides an additional measure about the stability of the signal AFTER removal of the mean seasonal cylce.

+000 deg


+057/+063 deg