DIRECT_00110


Location

lon / lat [deg]: 35.0333 / 31.35

Source network: DIRECT


Geostationary surface albedo (GSA) data


“+000”


“+057/+063”


Landcover information (based on ESA CCI landcover data)


Landcover fractions @ 2km distance


Landcover fractions @ 20 km distance


Legend


Distance to open water bodies [km]:

23.15

Distance to urban areas [km]:

6.72


Radius: 1 km

Number of landcover classes:

6

Dominant landcover type:

10: cropland, rainfed

Fraction of dominant landcover type [%]:

36.0


Radius: 2 km

Number of landcover classes:

7

Dominant landcover type:

150: Sparse vegetation (tree, shrub, herbaceous cover) (<15%)

Fraction of dominant landcover type [%]:

42.0


Radius: 5 km

Number of landcover classes:

5

Dominant landcover type:

150: Sparse vegetation (tree, shrub, herbaceous cover) (<15%)

Fraction of dominant landcover type [%]:

65.0


Radius: 10 km

Number of landcover classes:

3

Dominant landcover type:

150: Sparse vegetation (tree, shrub, herbaceous cover) (<15%)

Fraction of dominant landcover type [%]:

65.0


Radius: 20 km

Number of landcover classes:

4

Dominant landcover type:

150: Sparse vegetation (tree, shrub, herbaceous cover) (<15%)

Fraction of dominant landcover type [%]:

46.0


Disturbances


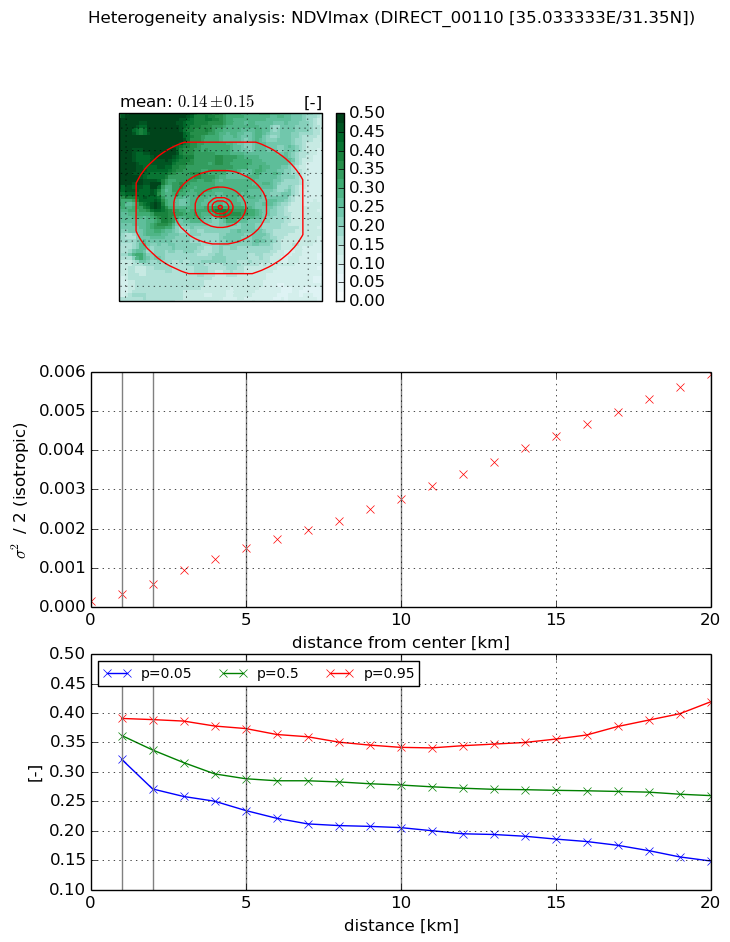
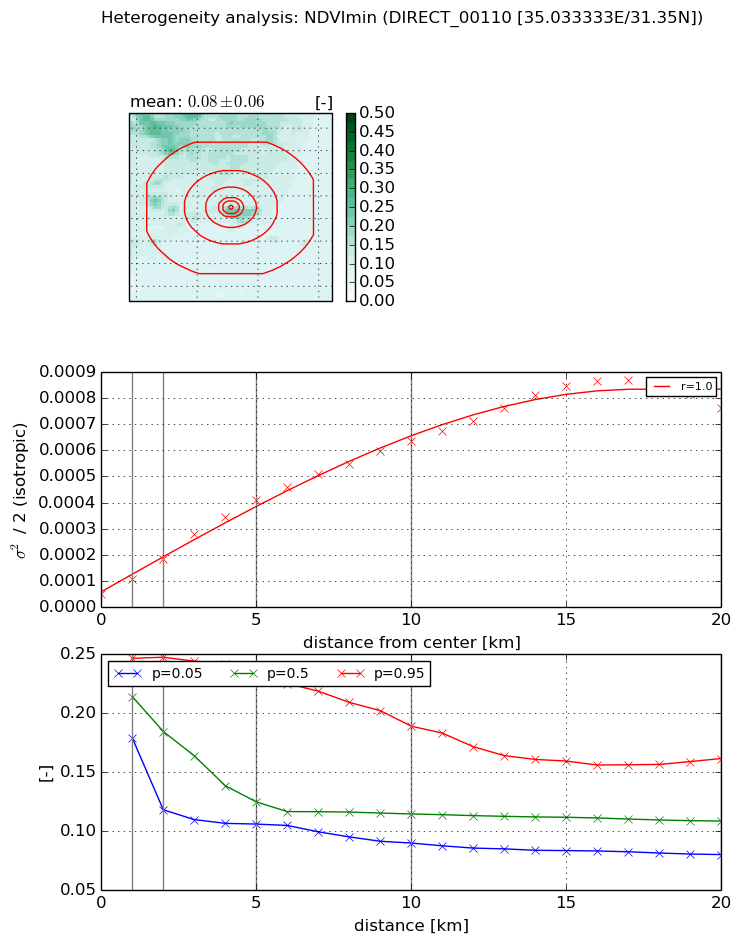
Heterogeneity analysis

The heterogeneity analysis provides information about the spatial and temporal heterogeneity of the site.

Topography


Roman et al. (2009) index


St

5.34631109452

Rcv

0.451950883425

Rse

0.0

Rst

2.0084146554e-08

Rsv

-0.109183670772


Height range @ 1km [m]

70

Height range @ 2km [m]

122

Height range @ 5km [m]

228

Height range @ 10km [m]

-999

Height range @ 20km [m]

-999


Variance slope @ 1 km

669

Variance slope @ 2 km

679

Variance slope @ 5 km

1008

Variance slope @ 10 km

-999

Variance slope @ 20 km

-999


NDVI (max. NDVI composite)


Roman et al. (2009) index


St

8.27427510763

Rcv

0.0440707935699

Rse

0.0

Rst

-0.205528848575

Rsv

0.1129698834


NDVI range @ 1km [-]

0.07

NDVI range @ 2km [-]

0.12

NDVI range @ 5km [-]

0.14

NDVI range @ 10km [-]

0.14

NDVI range @ 20km [-]

0.27


Variance slope @ 1 km

0.000197825874294

Variance slope @ 2 km

0.000225473470417

Variance slope @ 5 km

0.00028072789956

Variance slope @ 10 km

0.000264303621796

Variance slope @ 20 km

0.000290362400561


NDVI (min. NDVI composite)I


Roman et al. (2009) index


St

5.4037504222

Rcv

0.0552456147358

Rse

0.0

Rst

0.184782601288

Rsv

-0.31514176142


NDVI range @ 1km [-]

0.07

NDVI range @ 2km [-]

0.13

NDVI range @ 5km [-]

0.13

NDVI range @ 10km [-]

0.1

NDVI range @ 20km [-]

0.08


NDVI slope @ 1 km

5.78988571768e-05

NDVI slope @ 2 km

6.66975404646e-05

NDVI slope @ 5 km

7.40688010331e-05

NDVI slope @ 10 km

5.96385591901e-05

NDVI slope @ 20 km

4.00852967089e-05


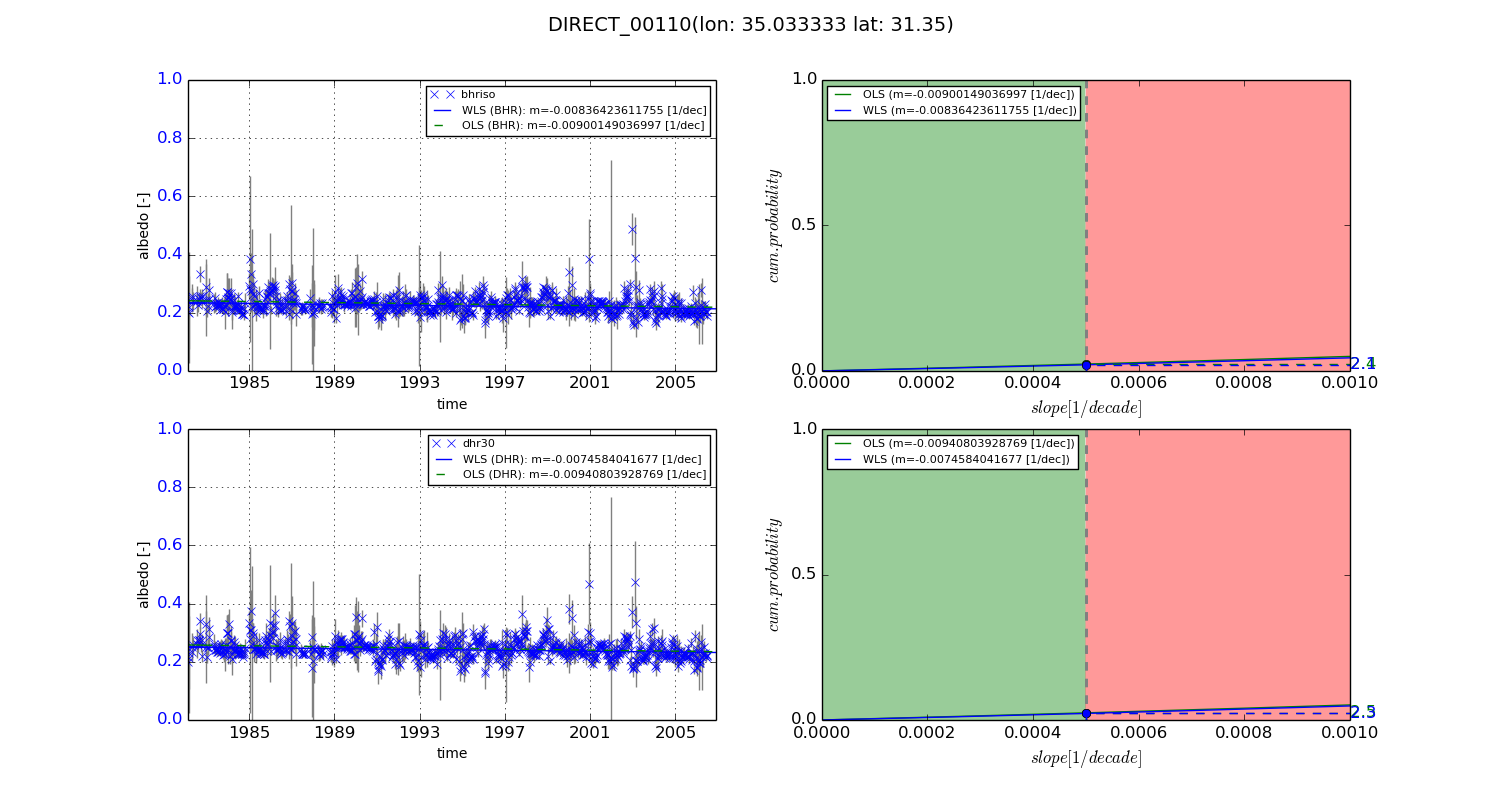
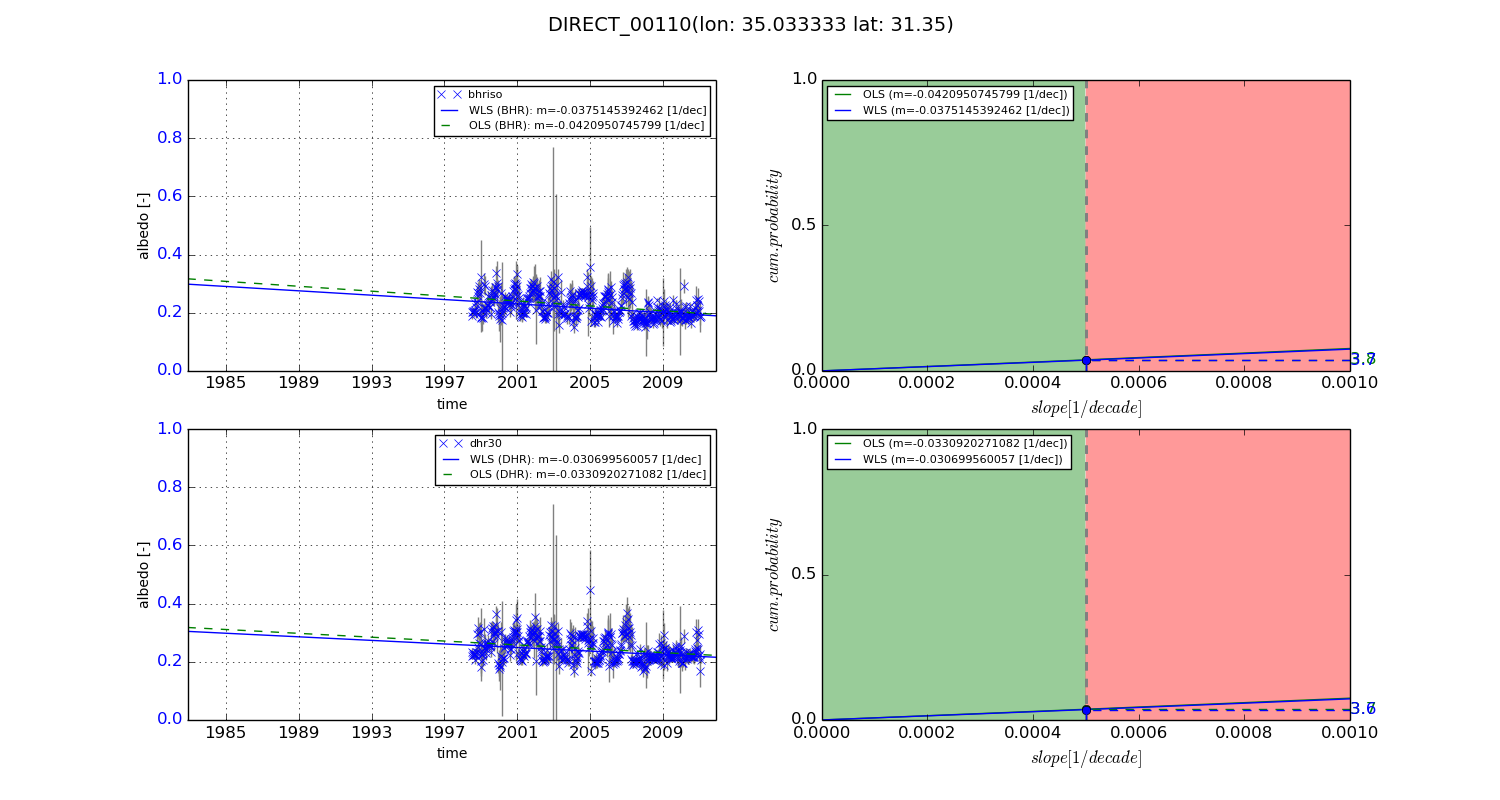
Temporal stability analysis

+000 deg (BHR)


BHR statistics

Temporal stability [1/decade]:


abs

rel


Weighted least square:

-0.00836423611755


Ordinary least square:

-0.00900149036997


Probabilities that GCOS criteria is met:

Weighted least square:

2.1 %

Ordinary least square:

2.4 %


DHR statistics

Temporal stability [1/decade]:


abs

rel


Weighted least square:

-0.0074584041677


Ordinary least square:

-0.00940803928769


Probabilities that GCOS criteria is met:

Weighted least square:

2.3 %

Ordinary least square:

2.5 %


+057/+063 deg (BHR)


BHR statistics

Temporal stability [1/decade]:


abs

rel


Weighted least square:

-0.0375145392462


Ordinary least square:

-0.0420950745799


Probabilities that GCOS criteria is met:

Weighted least square:

3.7 %

Ordinary least square:

3.8 %


DHR statistics

Temporal stability [1/decade]:


abs

rel


Weighted least square:

-0.030699560057


Ordinary least square:

-0.0330920271082


Probabilities that GCOS criteria is met:

Weighted least square:

3.6 %

Ordinary least square:

3.7 %


Temporal anomaly analyis

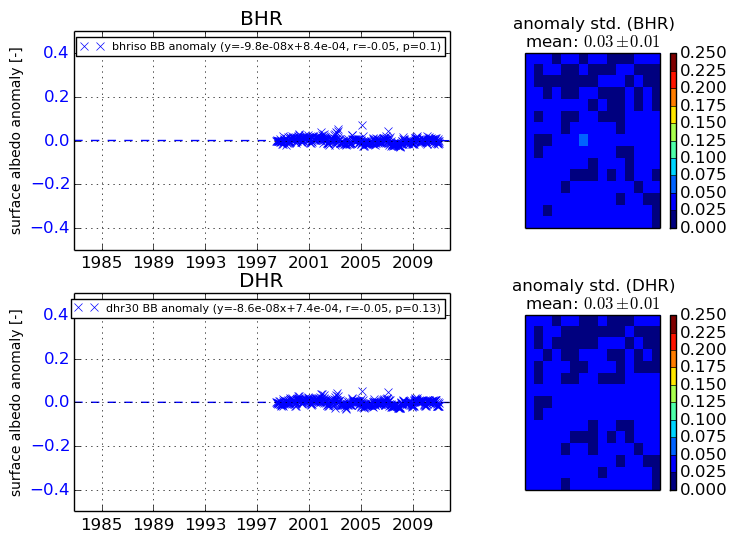
The variance of the temporal anomalies provides an additional measure about the stability of the signal AFTER removal of the mean seasonal cylce.
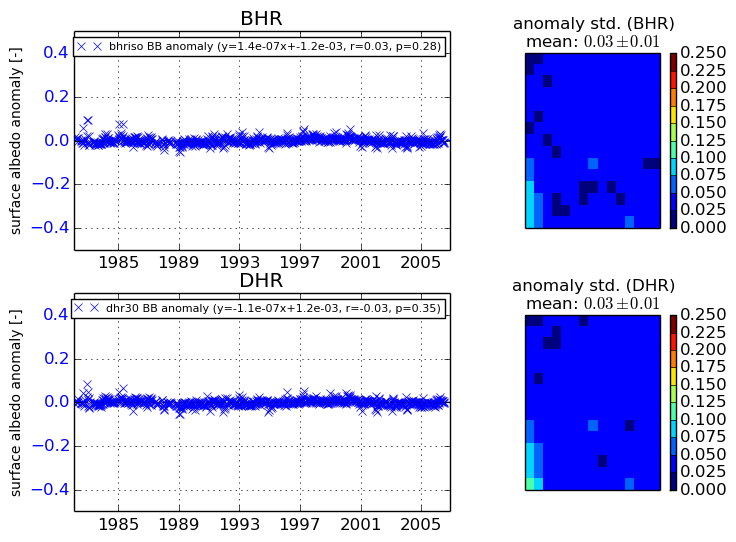
+000 deg


+057/+063 deg