DIRECT_00111


Location

lon / lat [deg]: -0.4771 / 46.1636

Source network: DIRECT


Geostationary surface albedo (GSA) data


“+000”


“+057/+063”


Landcover information (based on ESA CCI landcover data)


Landcover fractions @ 2km distance


Landcover fractions @ 20 km distance


Legend


Distance to open water bodies [km]:

39.11

Distance to urban areas [km]:

1.42


Radius: 1 km

Number of landcover classes:

1

Dominant landcover type:

10: cropland, rainfed

Fraction of dominant landcover type [%]:

100.0


Radius: 2 km

Number of landcover classes:

4

Dominant landcover type:

10: cropland, rainfed

Fraction of dominant landcover type [%]:

94.0


Radius: 5 km

Number of landcover classes:

3

Dominant landcover type:

10: cropland, rainfed

Fraction of dominant landcover type [%]:

80.0


Radius: 10 km

Number of landcover classes:

3

Dominant landcover type:

10: cropland, rainfed

Fraction of dominant landcover type [%]:

83.0


Radius: 20 km

Number of landcover classes:

3

Dominant landcover type:

10: cropland, rainfed

Fraction of dominant landcover type [%]:

88.0


Disturbances


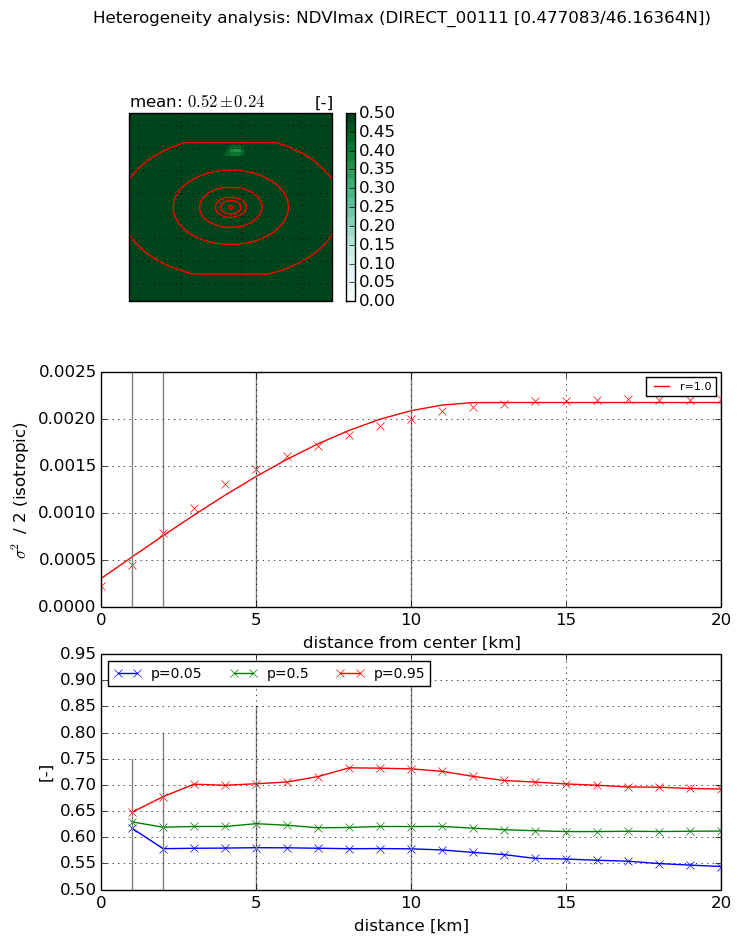
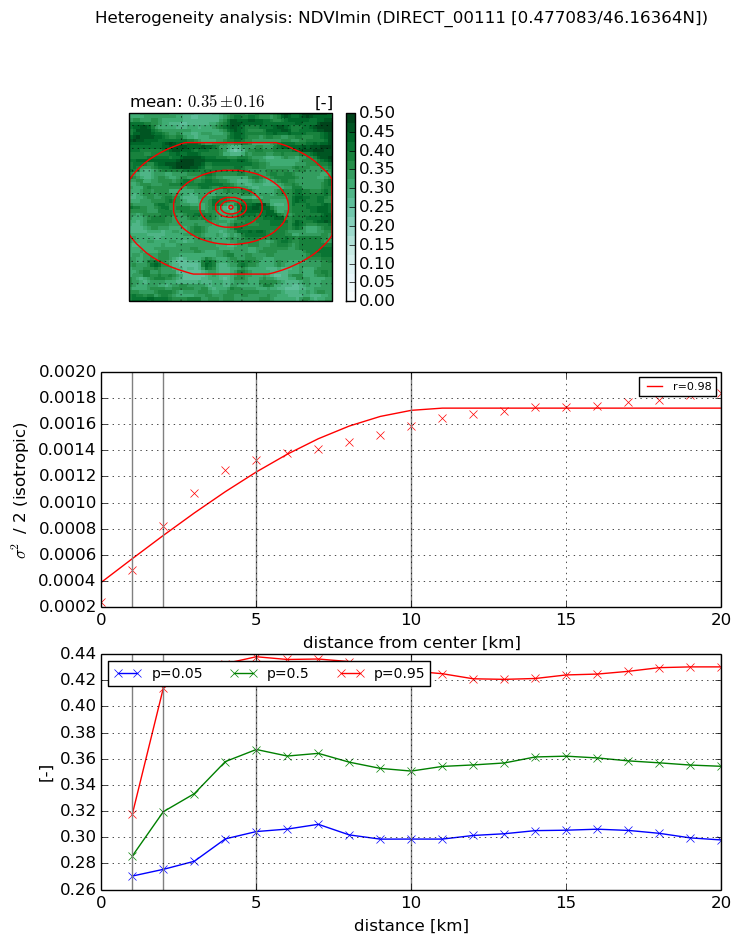
Heterogeneity analysis

The heterogeneity analysis provides information about the spatial and temporal heterogeneity of the site.

Topography


Roman et al. (2009) index


St

17.4016666332

Rcv

0.0653934330664

Rse

0.0

Rst

-0.0635000441721

Rsv

-0.0435038030467


Height range @ 1km [m]

19

Height range @ 2km [m]

35

Height range @ 5km [m]

45

Height range @ 10km [m]

-999

Height range @ 20km [m]

-999


Variance slope @ 1 km

58

Variance slope @ 2 km

56

Variance slope @ 5 km

50

Variance slope @ 10 km

-999

Variance slope @ 20 km

-999


NDVI (max. NDVI composite)


Roman et al. (2009) index


St

nan

Rcv

nan

Rse

nan

Rst

nan

Rsv

nan


NDVI range @ 1km [-]

0.03

NDVI range @ 2km [-]

0.1

NDVI range @ 5km [-]

0.12

NDVI range @ 10km [-]

0.15

NDVI range @ 20km [-]

0.15


Variance slope @ 1 km

0.000223465766551

Variance slope @ 2 km

0.000279753382227

Variance slope @ 5 km

0.000257900344533

Variance slope @ 10 km

0.000177103848303

Variance slope @ 20 km

8.88707431565e-05


NDVI (min. NDVI composite)I


Roman et al. (2009) index


St

2.91546844239

Rcv

-0.131267620886

Rse

0.0

Rst

-0.521305573695

Rsv

0.376420965117


NDVI range @ 1km [-]

0.05

NDVI range @ 2km [-]

0.14

NDVI range @ 5km [-]

0.13

NDVI range @ 10km [-]

0.13

NDVI range @ 20km [-]

0.13


NDVI slope @ 1 km

0.000240609233716

NDVI slope @ 2 km

0.000291357891511

NDVI slope @ 5 km

0.00022771483916

NDVI slope @ 10 km

0.000123445697696

NDVI slope @ 20 km

6.28650869329e-05


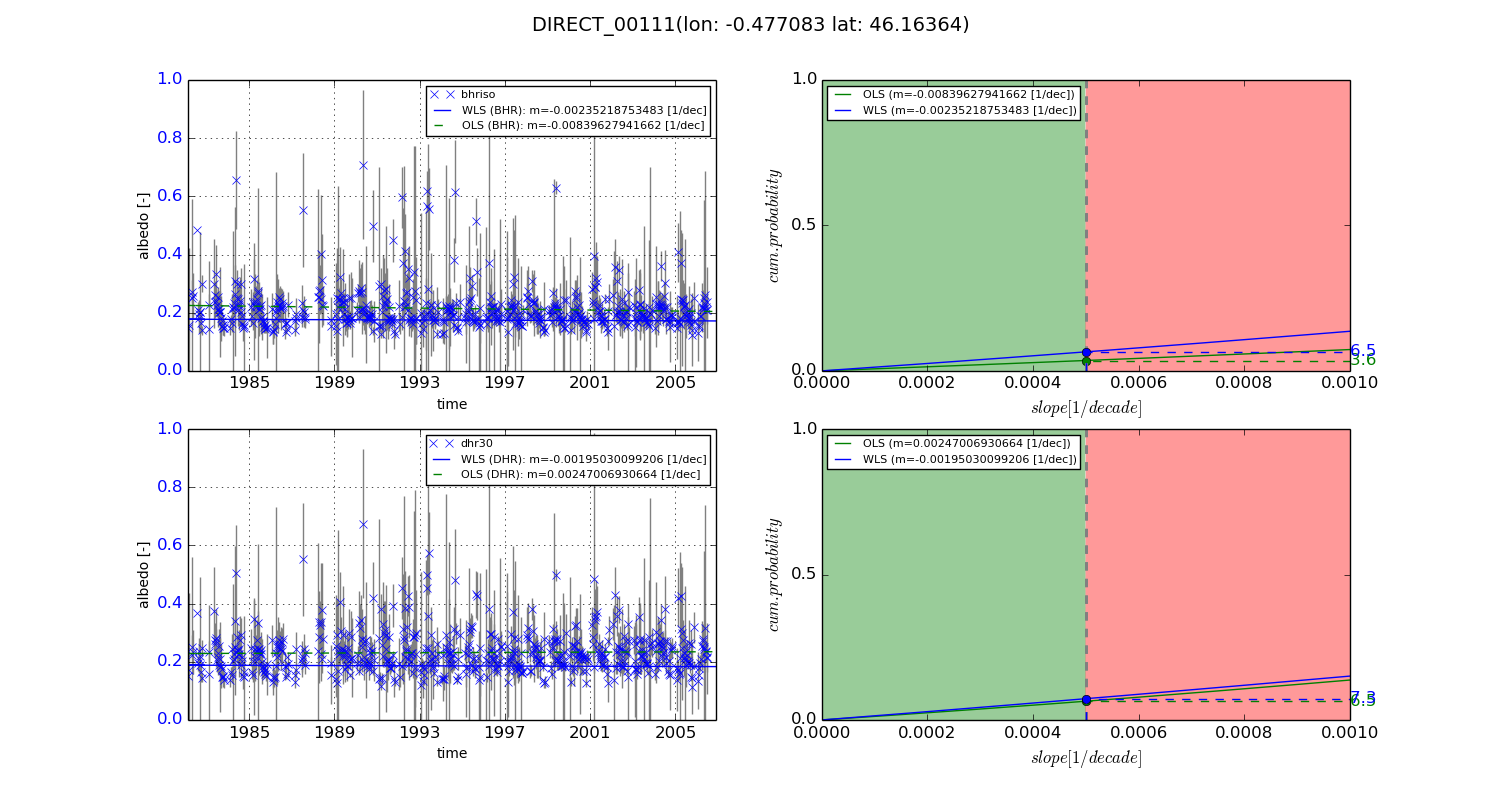
Temporal stability analysis

+000 deg (BHR)


BHR statistics

Temporal stability [1/decade]:


abs

rel


Weighted least square:

-0.00235218753483


Ordinary least square:

-0.00839627941662


Probabilities that GCOS criteria is met:

Weighted least square:

6.5 %

Ordinary least square:

3.6 %


DHR statistics

Temporal stability [1/decade]:


abs

rel


Weighted least square:

-0.00195030099206


Ordinary least square:

0.00247006930664


Probabilities that GCOS criteria is met:

Weighted least square:

7.3 %

Ordinary least square:

6.5 %


+057/+063 deg (BHR)


BHR statistics

Temporal stability [1/decade]:


abs

rel


Weighted least square:

-99999.0


Ordinary least square:

-99999.0


Probabilities that GCOS criteria is met:

Weighted least square:

-99999.0 %

Ordinary least square:

-99999.0 %


DHR statistics

Temporal stability [1/decade]:


abs

rel


Weighted least square:

-99999.0


Ordinary least square:

-99999.0


Probabilities that GCOS criteria is met:

Weighted least square:

-99999.0 %

Ordinary least square:

-99999.0 %


Temporal anomaly analyis

The variance of the temporal anomalies provides an additional measure about the stability of the signal AFTER removal of the mean seasonal cylce.
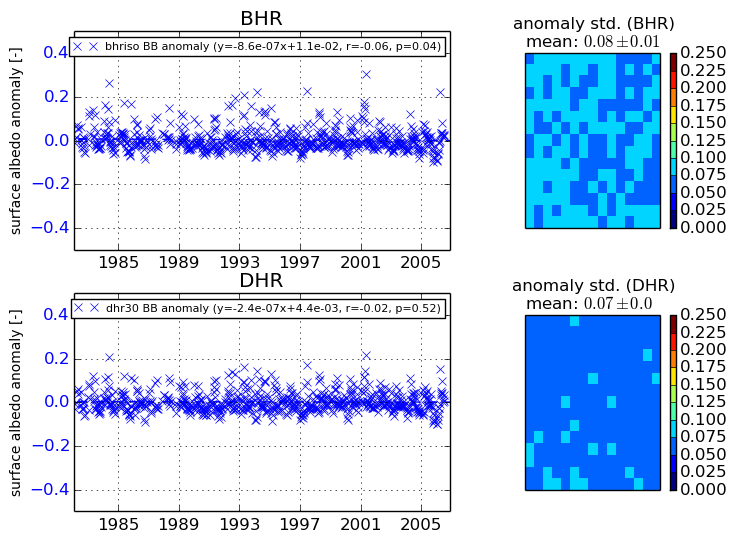
+000 deg


+057/+063 deg