DIRECT_00113


Location

lon / lat [deg]: -100.2819 / 19.6747

Source network: DIRECT


Geostationary surface albedo (GSA) data


“+000”


“+057/+063”


Landcover information (based on ESA CCI landcover data)


Landcover fractions @ 2km distance


Landcover fractions @ 20 km distance


Legend


Distance to open water bodies [km]:

9.79

Distance to urban areas [km]:

20.51


Radius: 1 km

Number of landcover classes:

1

Dominant landcover type:

70: Tree cover, needleleaved, evergreen, closed to open (>15%)

Fraction of dominant landcover type [%]:

100.0


Radius: 2 km

Number of landcover classes:

1

Dominant landcover type:

70: Tree cover, needleleaved, evergreen, closed to open (>15%)

Fraction of dominant landcover type [%]:

100.0


Radius: 5 km

Number of landcover classes:

2

Dominant landcover type:

70: Tree cover, needleleaved, evergreen, closed to open (>15%)

Fraction of dominant landcover type [%]:

97.0


Radius: 10 km

Number of landcover classes:

3

Dominant landcover type:

70: Tree cover, needleleaved, evergreen, closed to open (>15%)

Fraction of dominant landcover type [%]:

84.0


Radius: 20 km

Number of landcover classes:

5

Dominant landcover type:

70: Tree cover, needleleaved, evergreen, closed to open (>15%)

Fraction of dominant landcover type [%]:

55.0


Disturbances


Heterogeneity analysis

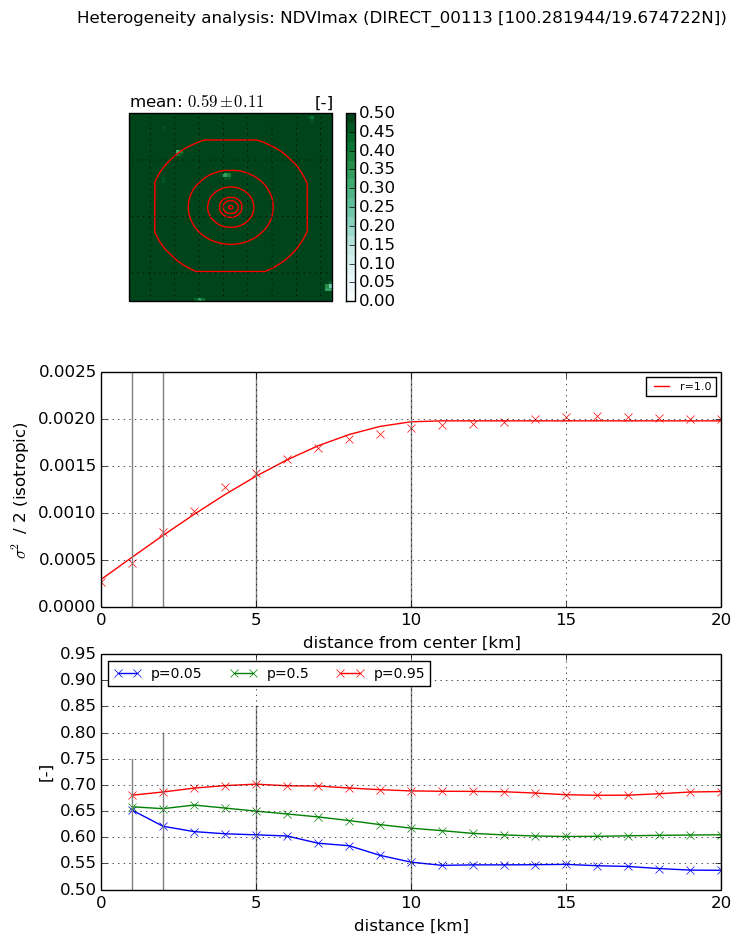
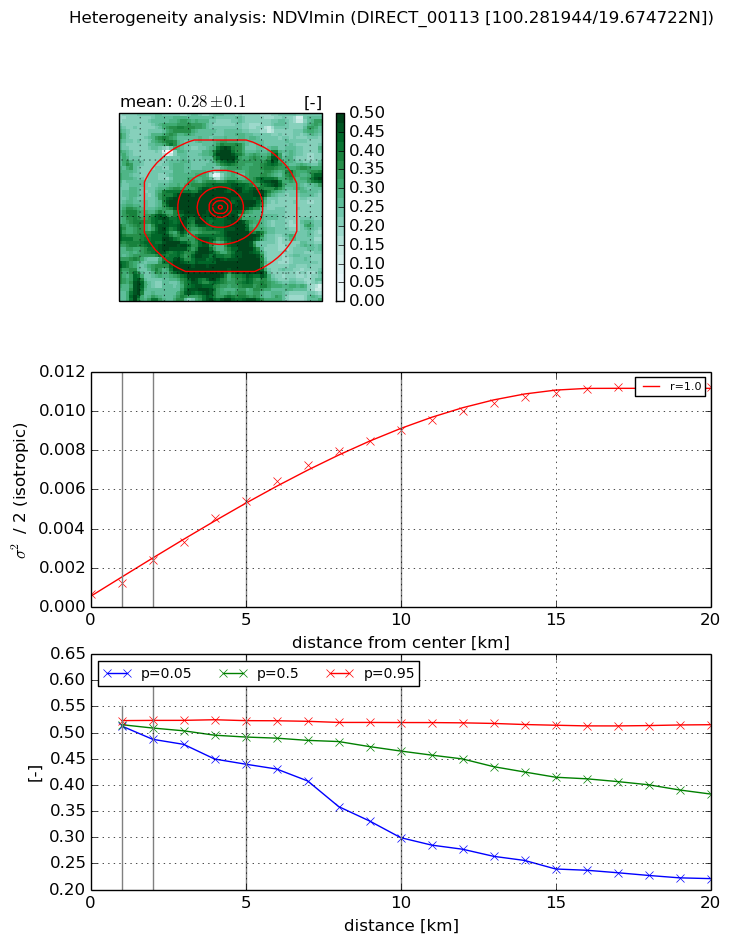
The heterogeneity analysis provides information about the spatial and temporal heterogeneity of the site.

Topography


Roman et al. (2009) index


St

1.34070565287

Rcv

0.716330586249

Rse

0.0

Rst

-0.0191032303663

Rsv

1.50219380402


Height range @ 1km [m]

222

Height range @ 2km [m]

277

Height range @ 5km [m]

643

Height range @ 10km [m]

-999

Height range @ 20km [m]

-999


Variance slope @ 1 km

8633

Variance slope @ 2 km

9348

Variance slope @ 5 km

11056

Variance slope @ 10 km

-999

Variance slope @ 20 km

-999


NDVI (max. NDVI composite)


Roman et al. (2009) index


St

2.64268505687

Rcv

0.150969637044

Rse

0.0

Rst

-0.0604541613203

Rsv

0.923785254337


NDVI range @ 1km [-]

0.03

NDVI range @ 2km [-]

0.07

NDVI range @ 5km [-]

0.1

NDVI range @ 10km [-]

0.14

NDVI range @ 20km [-]

0.15


Variance slope @ 1 km

0.000196187488909

Variance slope @ 2 km

0.000263394175892

Variance slope @ 5 km

0.000241850673383

Variance slope @ 10 km

0.000166161288747

Variance slope @ 20 km

7.55653203344e-05


NDVI (min. NDVI composite)I


Roman et al. (2009) index


St

1.9567942495

Rcv

0.670913260462

Rse

0.0

Rst

-0.410509060468

Rsv

0.451697474763


NDVI range @ 1km [-]

0.01

NDVI range @ 2km [-]

0.04

NDVI range @ 5km [-]

0.08

NDVI range @ 10km [-]

0.22

NDVI range @ 20km [-]

0.29


NDVI slope @ 1 km

0.000586486353068

NDVI slope @ 2 km

0.000871643966125

NDVI slope @ 5 km

0.000990795598653

NDVI slope @ 10 km

0.000884740600445

NDVI slope @ 20 km

0.000547755705523


Temporal stability analysis

+000 deg (BHR)


BHR statistics

Temporal stability [1/decade]:


abs

rel


Weighted least square:

None


Ordinary least square:

None


Probabilities that GCOS criteria is met:

Weighted least square:

None %

Ordinary least square:

None %


DHR statistics

Temporal stability [1/decade]:


abs

rel


Weighted least square:

None


Ordinary least square:

None


Probabilities that GCOS criteria is met:

Weighted least square:

None %

Ordinary least square:

None %


+057/+063 deg (BHR)


BHR statistics

Temporal stability [1/decade]:


abs

rel


Weighted least square:

None


Ordinary least square:

None


Probabilities that GCOS criteria is met:

Weighted least square:

None %

Ordinary least square:

None %


DHR statistics

Temporal stability [1/decade]:


abs

rel


Weighted least square:

None


Ordinary least square:

None


Probabilities that GCOS criteria is met:

Weighted least square:

None %

Ordinary least square:

None %


Temporal anomaly analyis

The variance of the temporal anomalies provides an additional measure about the stability of the signal AFTER removal of the mean seasonal cylce.

+000 deg


+057/+063 deg