DMN_MAINE_SOROA


Location

lon / lat [deg]: 12.0231 / 13.2167

Source network: AERONET


Geostationary surface albedo (GSA) data


“+000”


“+057/+063”


Landcover information (based on ESA CCI landcover data)


Landcover fractions @ 2km distance


Landcover fractions @ 20 km distance


Legend


Distance to open water bodies [km]:

26.44

Distance to urban areas [km]:

36.07


Radius: 1 km

Number of landcover classes:

2

Dominant landcover type:

130: grassland

Fraction of dominant landcover type [%]:

71.0


Radius: 2 km

Number of landcover classes:

3

Dominant landcover type:

130: grassland

Fraction of dominant landcover type [%]:

70.0


Radius: 5 km

Number of landcover classes:

4

Dominant landcover type:

10: cropland, rainfed

Fraction of dominant landcover type [%]:

58.0


Radius: 10 km

Number of landcover classes:

4

Dominant landcover type:

10: cropland, rainfed

Fraction of dominant landcover type [%]:

60.0


Radius: 20 km

Number of landcover classes:

5

Dominant landcover type:

10: cropland, rainfed

Fraction of dominant landcover type [%]:

69.0


Disturbances


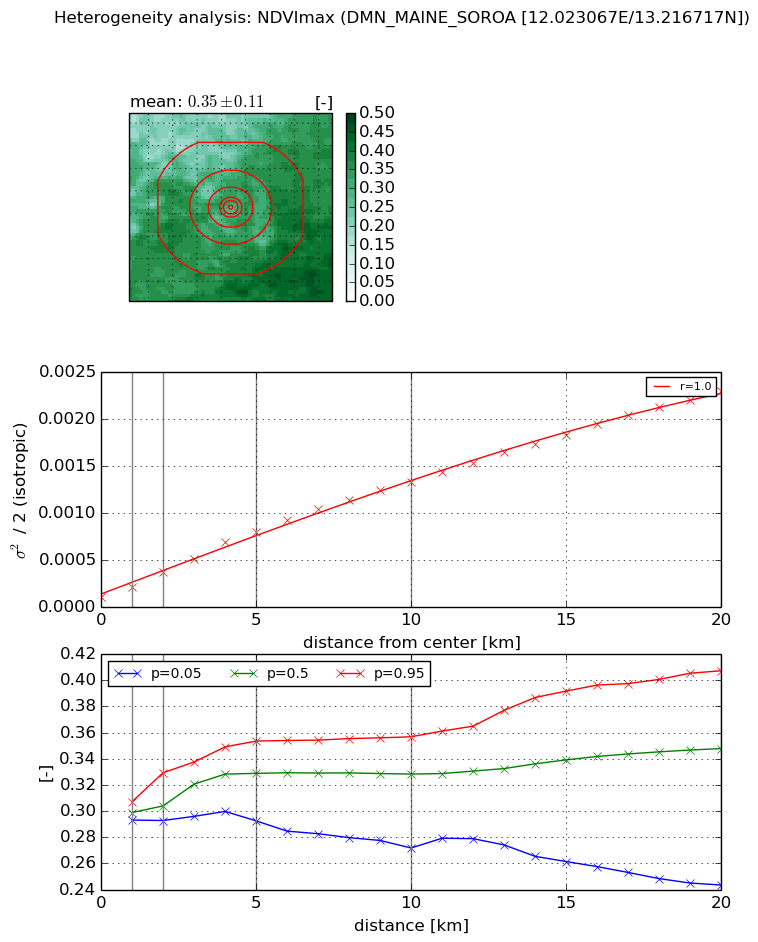
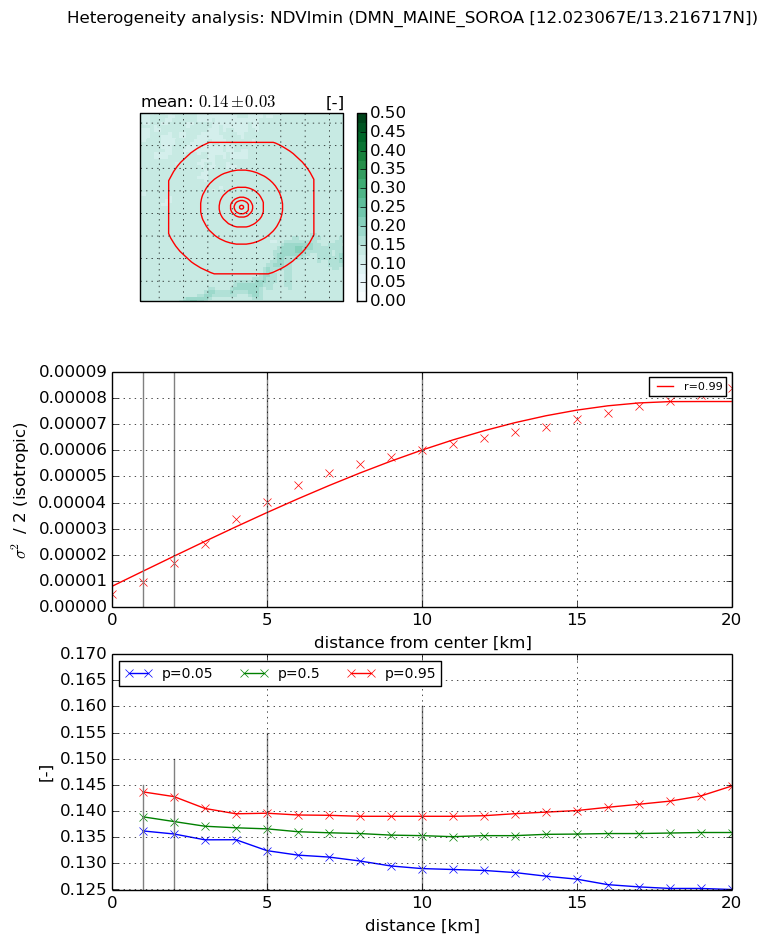
Heterogeneity analysis

The heterogeneity analysis provides information about the spatial and temporal heterogeneity of the site.

Topography


Roman et al. (2009) index


St

56.7571499366

Rcv

-0.0509828949202

Rse

0.0

Rst

-0.000567517427381

Rsv

-0.00130636434666


Height range @ 1km [m]

22

Height range @ 2km [m]

27

Height range @ 5km [m]

26

Height range @ 10km [m]

-999

Height range @ 20km [m]

-999


Variance slope @ 1 km

77

Variance slope @ 2 km

22

Variance slope @ 5 km

4

Variance slope @ 10 km

-999

Variance slope @ 20 km

-999


NDVI (max. NDVI composite)


Roman et al. (2009) index


St

1.5179087252

Rcv

0.4305541708

Rse

0.0

Rst

-0.545849469663

Rsv

-0.999999782346


NDVI range @ 1km [-]

0.01

NDVI range @ 2km [-]

0.04

NDVI range @ 5km [-]

0.06

NDVI range @ 10km [-]

0.09

NDVI range @ 20km [-]

0.16


Variance slope @ 1 km

9.75214042147e-05

Variance slope @ 2 km

0.000129720472347

Variance slope @ 5 km

0.000143483331247

Variance slope @ 10 km

0.000125561894299

Variance slope @ 20 km

0.000108127977455


NDVI (min. NDVI composite)I


Roman et al. (2009) index


St

nan

Rcv

nan

Rse

nan

Rst

nan

Rsv

nan


NDVI range @ 1km [-]

0.01

NDVI range @ 2km [-]

0.01

NDVI range @ 5km [-]

0.01

NDVI range @ 10km [-]

0.01

NDVI range @ 20km [-]

0.02


NDVI slope @ 1 km

4.32389537739e-06

NDVI slope @ 2 km

5.85432543096e-06

NDVI slope @ 5 km

7.29921097765e-06

NDVI slope @ 10 km

5.87835864022e-06

NDVI slope @ 20 km

3.71235556339e-06


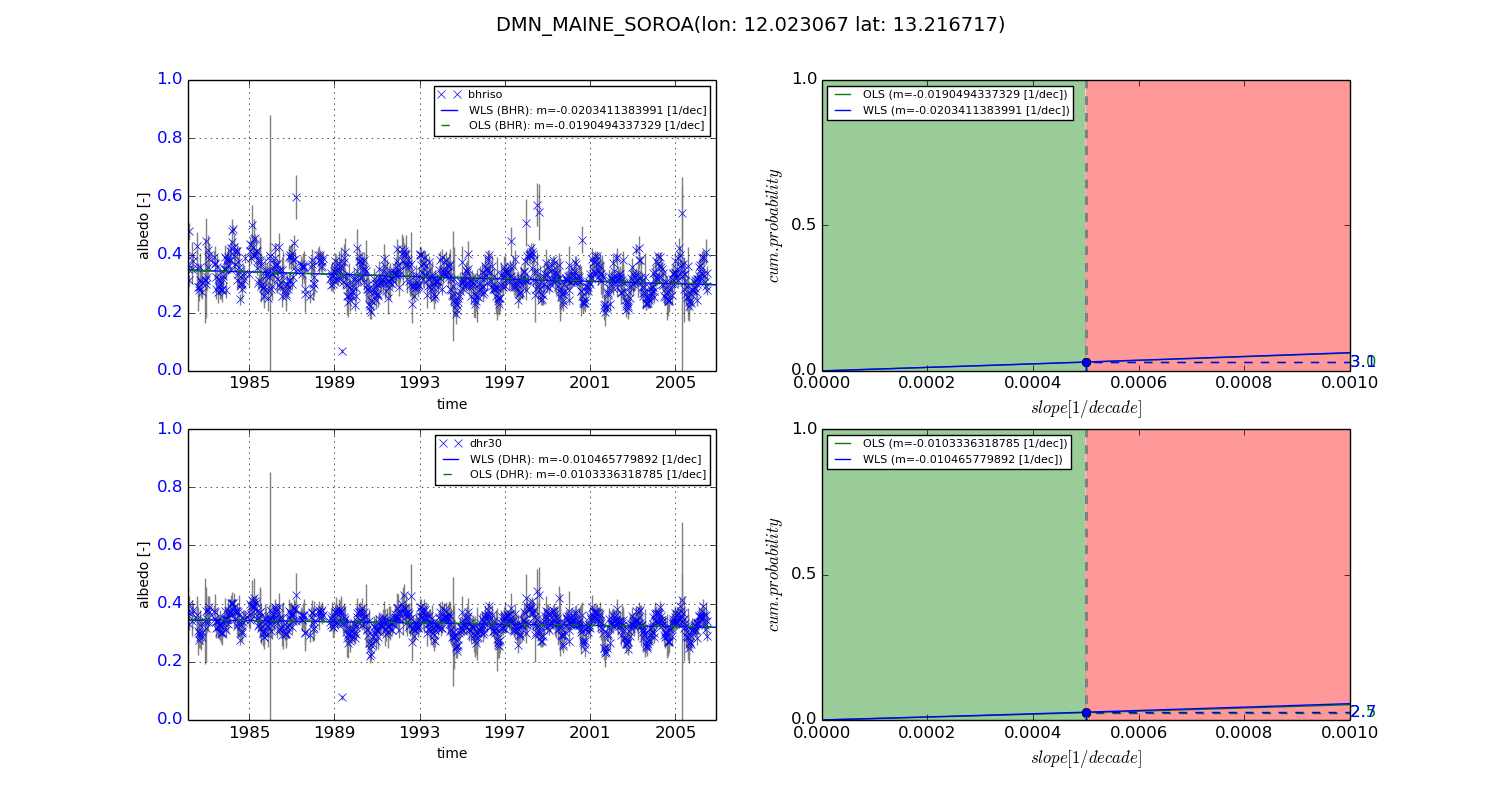
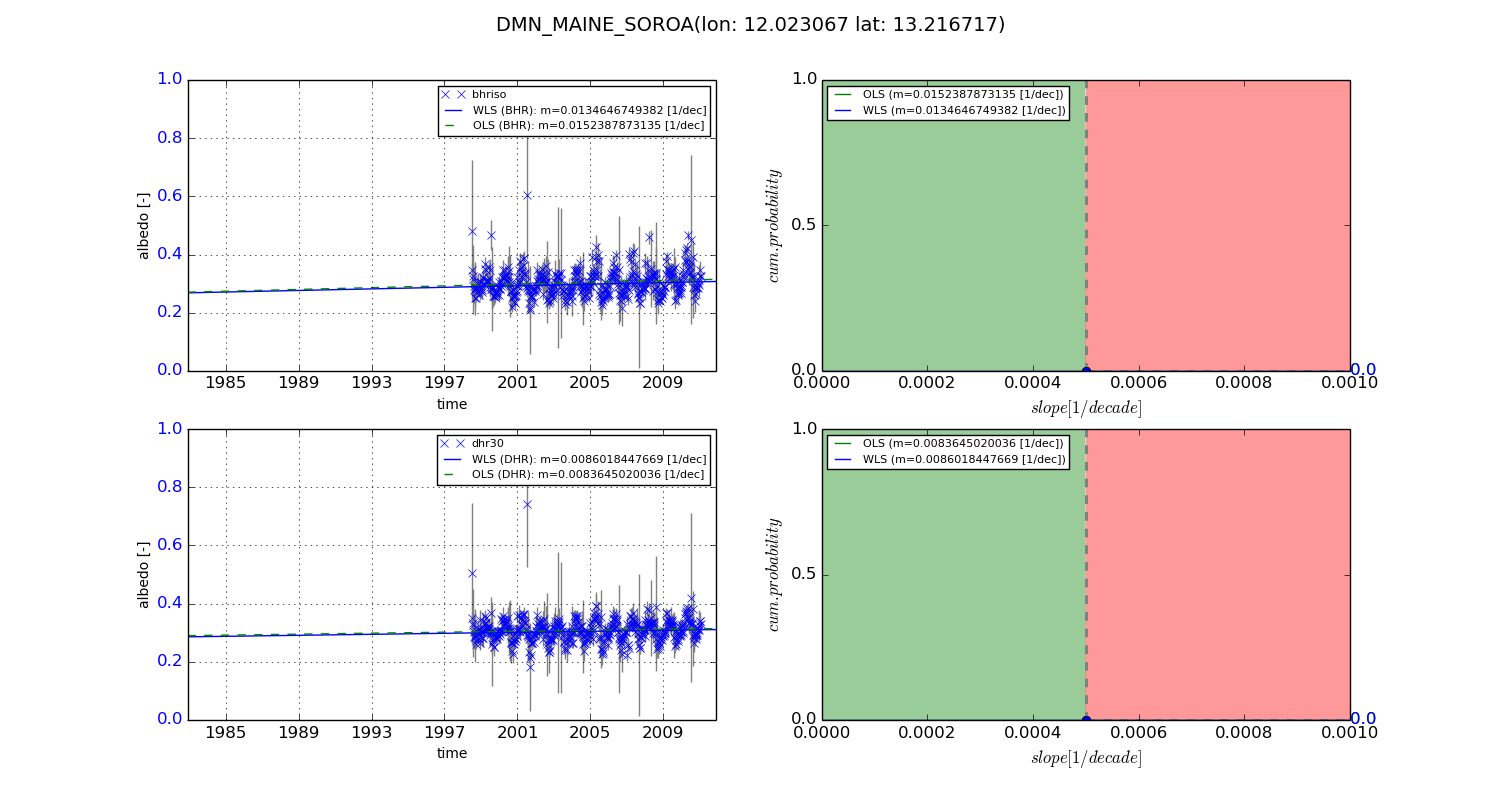
Temporal stability analysis

+000 deg (BHR)


BHR statistics

Temporal stability [1/decade]:


abs

rel


Weighted least square:

-0.0203411383991


Ordinary least square:

-0.0190494337329


Probabilities that GCOS criteria is met:

Weighted least square:

3.1 %

Ordinary least square:

3.0 %


DHR statistics

Temporal stability [1/decade]:


abs

rel


Weighted least square:

-0.010465779892


Ordinary least square:

-0.0103336318785


Probabilities that GCOS criteria is met:

Weighted least square:

2.7 %

Ordinary least square:

2.5 %


+057/+063 deg (BHR)


BHR statistics

Temporal stability [1/decade]:


abs

rel


Weighted least square:

0.0134646749382


Ordinary least square:

0.0152387873135


Probabilities that GCOS criteria is met:

Weighted least square:

0.0 %

Ordinary least square:

0.0 %


DHR statistics

Temporal stability [1/decade]:


abs

rel


Weighted least square:

0.0086018447669


Ordinary least square:

0.0083645020036


Probabilities that GCOS criteria is met:

Weighted least square:

0.0 %

Ordinary least square:

0.0 %


Temporal anomaly analyis

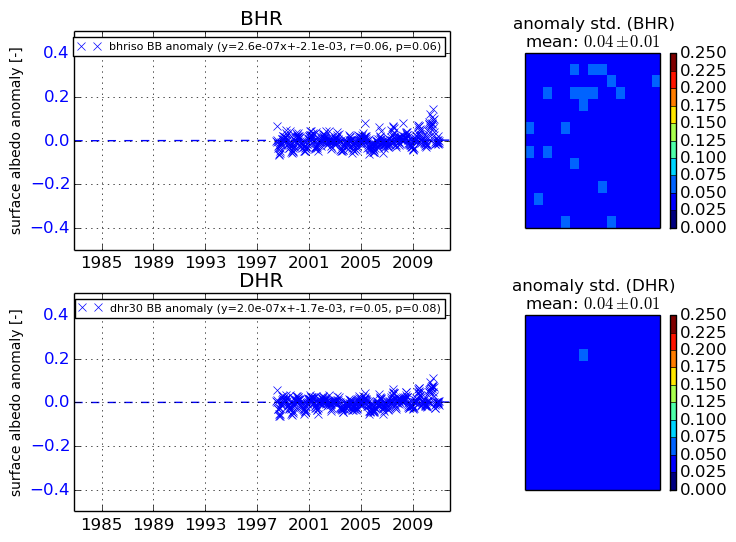
The variance of the temporal anomalies provides an additional measure about the stability of the signal AFTER removal of the mean seasonal cylce.
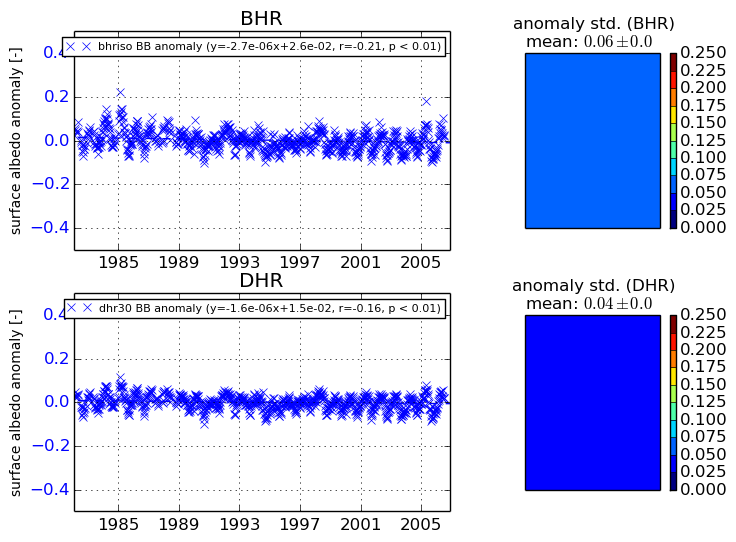
+000 deg


+057/+063 deg