DOI_ANG_KHANG


Location

lon / lat [deg]: 99.0454 / 19.9324

Source network: AERONET


Geostationary surface albedo (GSA) data


“+000”


“+057/+063”


Landcover information (based on ESA CCI landcover data)


Landcover fractions @ 2km distance


Landcover fractions @ 20 km distance


Legend


Distance to open water bodies [km]:

23.49

Distance to urban areas [km]:

13.34


Radius: 1 km

Number of landcover classes:

5

Dominant landcover type:

70: Tree cover, needleleaved, evergreen, closed to open (>15%)

Fraction of dominant landcover type [%]:

34.0


Radius: 2 km

Number of landcover classes:

5

Dominant landcover type:

70: Tree cover, needleleaved, evergreen, closed to open (>15%)

Fraction of dominant landcover type [%]:

46.0


Radius: 5 km

Number of landcover classes:

6

Dominant landcover type:

70: Tree cover, needleleaved, evergreen, closed to open (>15%)

Fraction of dominant landcover type [%]:

43.0


Radius: 10 km

Number of landcover classes:

7

Dominant landcover type:

70: Tree cover, needleleaved, evergreen, closed to open (>15%)

Fraction of dominant landcover type [%]:

29.0


Radius: 20 km

Number of landcover classes:

7

Dominant landcover type:

70: Tree cover, needleleaved, evergreen, closed to open (>15%)

Fraction of dominant landcover type [%]:

23.0


Disturbances


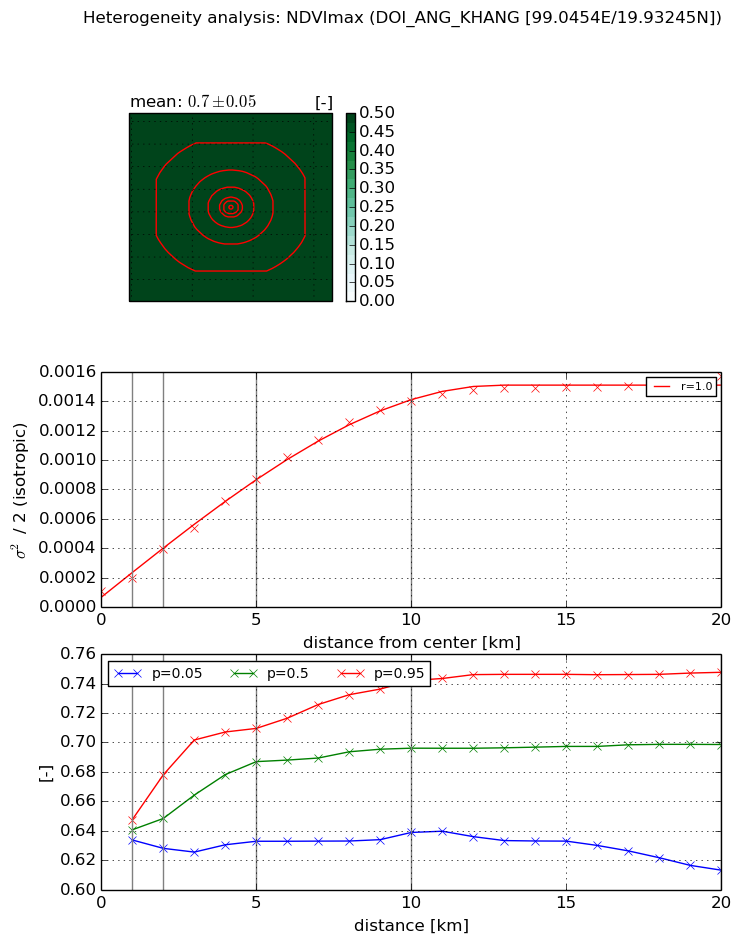
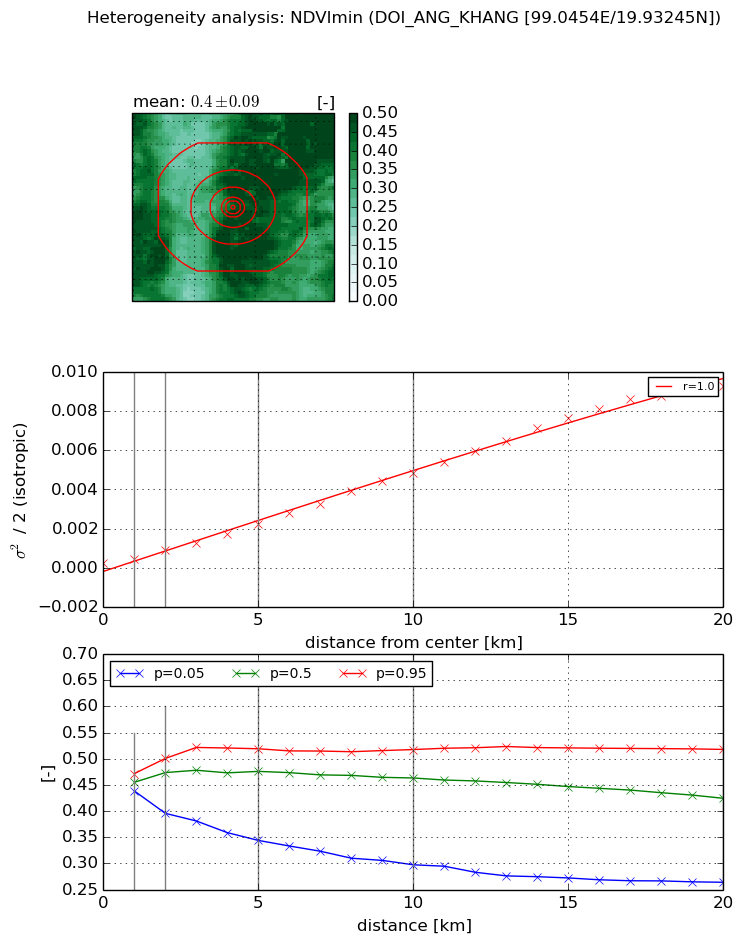
Heterogeneity analysis

The heterogeneity analysis provides information about the spatial and temporal heterogeneity of the site.

Topography


Roman et al. (2009) index


St

0.228040271565

Rcv

0.388687607273

Rse

0.0

Rst

6.48961074819e-08

Rsv

12.7668834005


Height range @ 1km [m]

177

Height range @ 2km [m]

488

Height range @ 5km [m]

844

Height range @ 10km [m]

-999

Height range @ 20km [m]

-999


Variance slope @ 1 km

16064

Variance slope @ 2 km

16335

Variance slope @ 5 km

19401

Variance slope @ 10 km

-999

Variance slope @ 20 km

-999


NDVI (max. NDVI composite)


Roman et al. (2009) index


St

10.1758896693

Rcv

-0.0237750774306

Rse

0.0

Rst

-0.0767451070749

Rsv

0.194294332702


NDVI range @ 1km [-]

0.01

NDVI range @ 2km [-]

0.05

NDVI range @ 5km [-]

0.08

NDVI range @ 10km [-]

0.1

NDVI range @ 20km [-]

0.13


Variance slope @ 1 km

8.89885897419e-05

Variance slope @ 2 km

0.00014073885852

Variance slope @ 5 km

0.000157030593952

Variance slope @ 10 km

0.000137466969321

Variance slope @ 20 km

6.96890528623e-05


NDVI (min. NDVI composite)I


Roman et al. (2009) index


St

6.64762839266e-09

Rcv

0.259554491409

Rse

0.0

Rst

0.225256145863

Rsv

451288763.386


NDVI range @ 1km [-]

0.03

NDVI range @ 2km [-]

0.1

NDVI range @ 5km [-]

0.18

NDVI range @ 10km [-]

0.22

NDVI range @ 20km [-]

0.25


NDVI slope @ 1 km

0.000192154413573

NDVI slope @ 2 km

0.000319832626106

NDVI slope @ 5 km

0.000404483927426

NDVI slope @ 10 km

0.000481105414623

NDVI slope @ 20 km

0.000494677808822


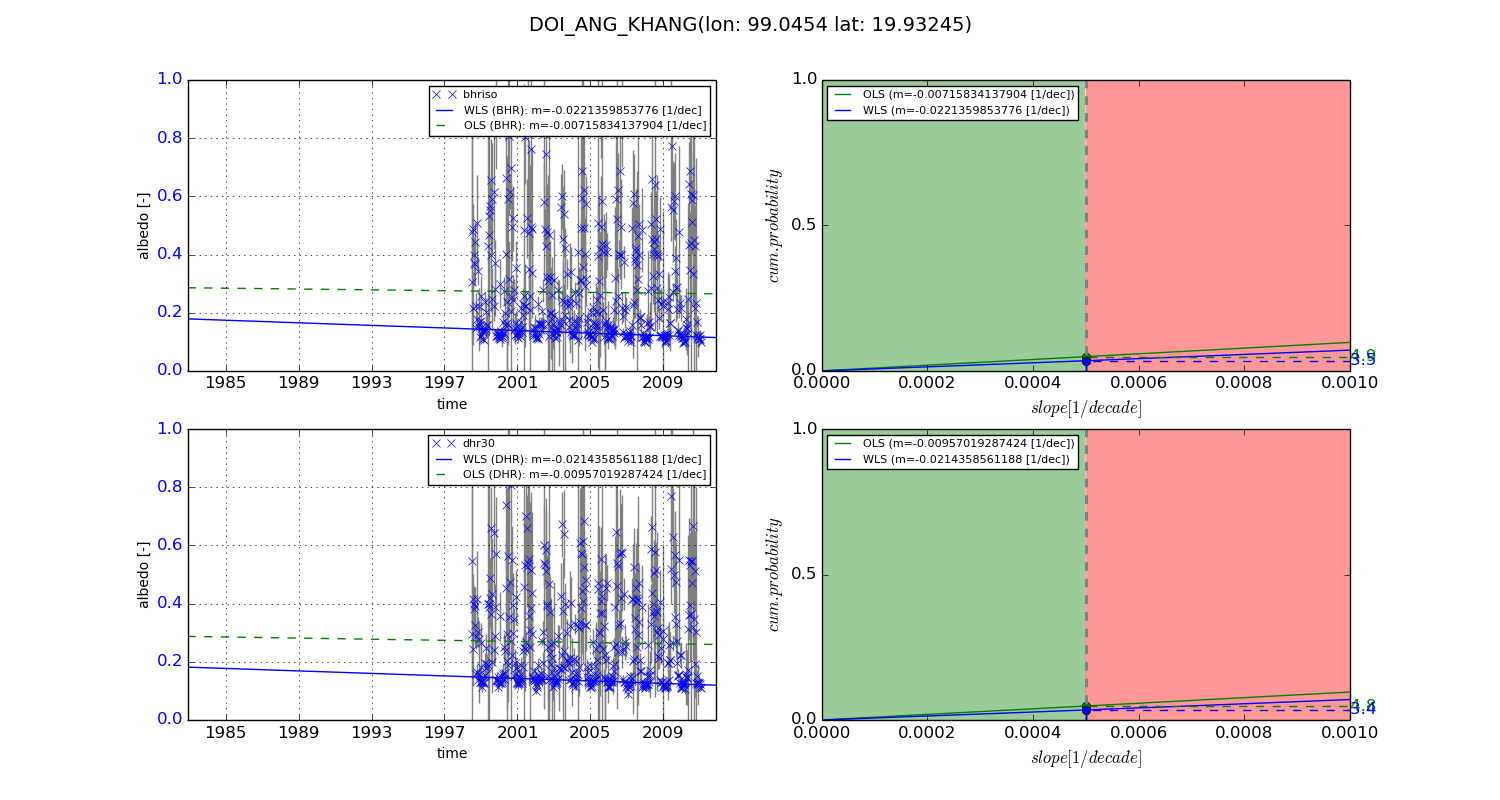
Temporal stability analysis

+000 deg (BHR)


BHR statistics

Temporal stability [1/decade]:


abs

rel


Weighted least square:

None


Ordinary least square:

None


Probabilities that GCOS criteria is met:

Weighted least square:

None %

Ordinary least square:

None %


DHR statistics

Temporal stability [1/decade]:


abs

rel


Weighted least square:

None


Ordinary least square:

None


Probabilities that GCOS criteria is met:

Weighted least square:

None %

Ordinary least square:

None %


+057/+063 deg (BHR)


BHR statistics

Temporal stability [1/decade]:


abs

rel


Weighted least square:

-0.0221359853776


Ordinary least square:

-0.00715834137904


Probabilities that GCOS criteria is met:

Weighted least square:

3.5 %

Ordinary least square:

4.9 %


DHR statistics

Temporal stability [1/decade]:


abs

rel


Weighted least square:

-0.0214358561188


Ordinary least square:

-0.00957019287424


Probabilities that GCOS criteria is met:

Weighted least square:

3.4 %

Ordinary least square:

4.8 %


Temporal anomaly analyis

The variance of the temporal anomalies provides an additional measure about the stability of the signal AFTER removal of the mean seasonal cylce.

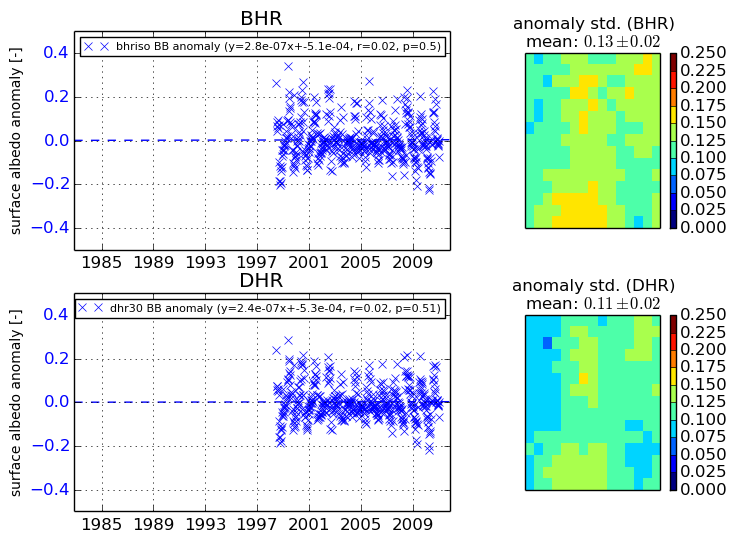
+000 deg


+057/+063 deg