DONETSK


Location

lon / lat [deg]: 37.8094 / 48.0208

Source network: AERONET


Geostationary surface albedo (GSA) data


“+000”


“+057/+063”


Landcover information (based on ESA CCI landcover data)


Landcover fractions @ 2km distance


Landcover fractions @ 20 km distance


Legend


Distance to open water bodies [km]:

0.85

Distance to urban areas [km]:

0.02


Radius: 1 km

Number of landcover classes:

2

Dominant landcover type:

190: urban areas

Fraction of dominant landcover type [%]:

96.0


Radius: 2 km

Number of landcover classes:

2

Dominant landcover type:

190: urban areas

Fraction of dominant landcover type [%]:

92.0


Radius: 5 km

Number of landcover classes:

2

Dominant landcover type:

190: urban areas

Fraction of dominant landcover type [%]:

98.0


Radius: 10 km

Number of landcover classes:

3

Dominant landcover type:

190: urban areas

Fraction of dominant landcover type [%]:

90.0


Radius: 20 km

Number of landcover classes:

3

Dominant landcover type:

190: urban areas

Fraction of dominant landcover type [%]:

52.0


Disturbances


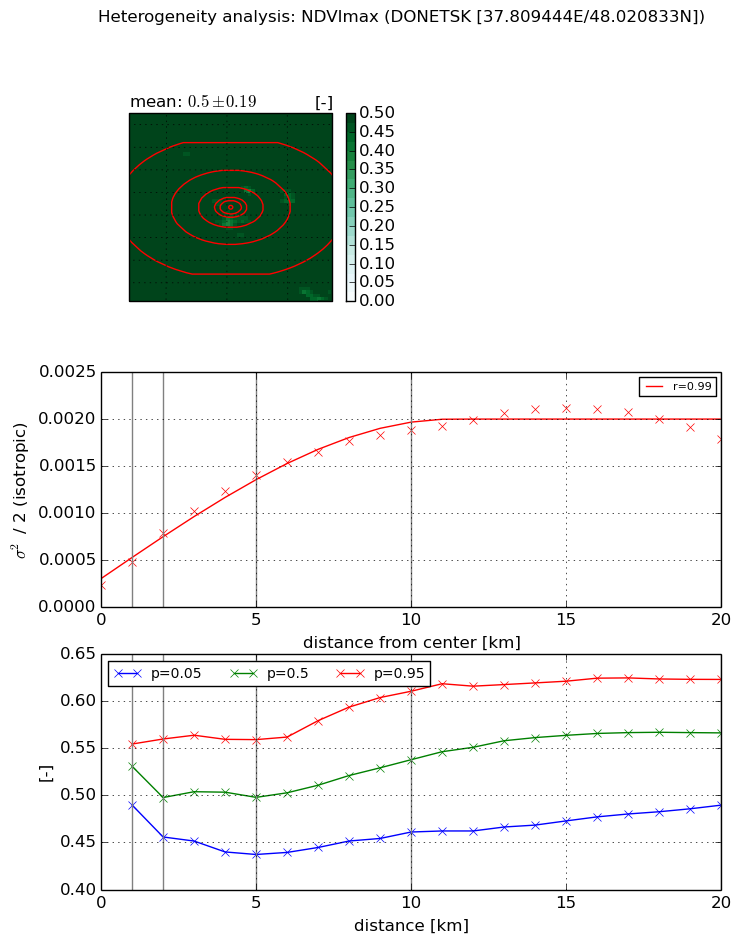
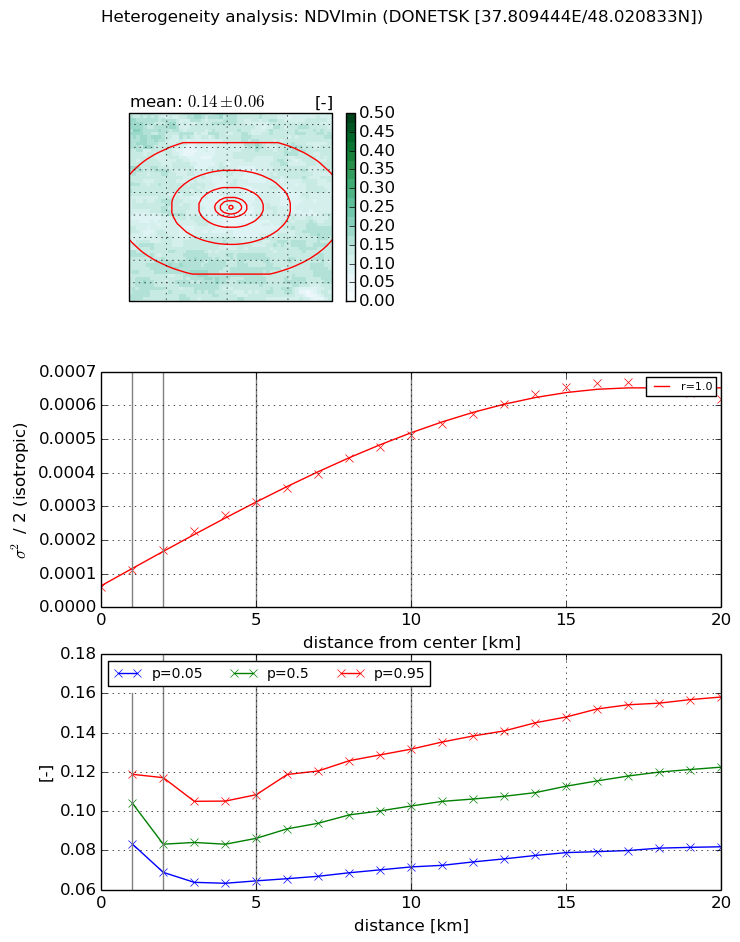
Heterogeneity analysis

The heterogeneity analysis provides information about the spatial and temporal heterogeneity of the site.

Topography


Roman et al. (2009) index


St

2.75826162717

Rcv

0.0738660610194

Rse

0.0

Rst

-0.0924707812288

Rsv

0.921304725342


Height range @ 1km [m]

79

Height range @ 2km [m]

87

Height range @ 5km [m]

94

Height range @ 10km [m]

-999

Height range @ 20km [m]

-999


Variance slope @ 1 km

221

Variance slope @ 2 km

235

Variance slope @ 5 km

202

Variance slope @ 10 km

-999

Variance slope @ 20 km

-999


NDVI (max. NDVI composite)


Roman et al. (2009) index


St

3.09638182672

Rcv

0.0517142117461

Rse

0.0

Rst

-0.134708375427

Rsv

0.782450170738


NDVI range @ 1km [-]

0.06

NDVI range @ 2km [-]

0.1

NDVI range @ 5km [-]

0.12

NDVI range @ 10km [-]

0.15

NDVI range @ 20km [-]

0.13


Variance slope @ 1 km

0.000246807251219

Variance slope @ 2 km

0.000274256588687

Variance slope @ 5 km

0.000239510963035

Variance slope @ 10 km

0.000164560550342

Variance slope @ 20 km

7.56891180261e-05


NDVI (min. NDVI composite)I


Roman et al. (2009) index


St

19.6373386588

Rcv

-0.0155596415877

Rse

0.0

Rst

0.0602663376747

Rsv

0.0769442128763


NDVI range @ 1km [-]

0.04

NDVI range @ 2km [-]

0.05

NDVI range @ 5km [-]

0.04

NDVI range @ 10km [-]

0.06

NDVI range @ 20km [-]

0.08


NDVI slope @ 1 km

5.14002830209e-05

NDVI slope @ 2 km

5.59471798494e-05

NDVI slope @ 5 km

5.18698728696e-05

NDVI slope @ 10 km

4.51745342841e-05

NDVI slope @ 20 km

3.04936847727e-05


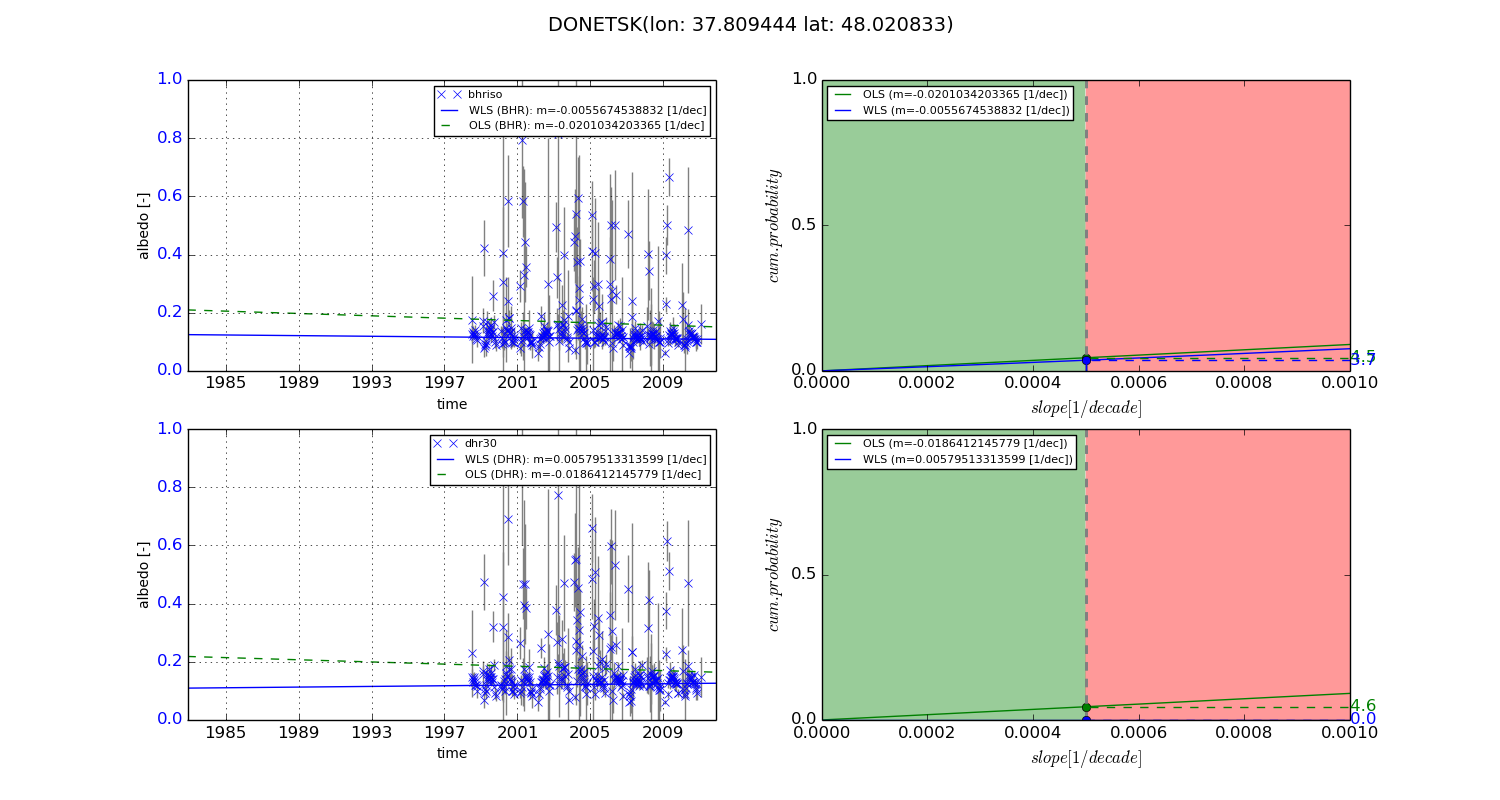
Temporal stability analysis

+000 deg (BHR)


BHR statistics

Temporal stability [1/decade]:


abs

rel


Weighted least square:

-99999.0


Ordinary least square:

-99999.0


Probabilities that GCOS criteria is met:

Weighted least square:

-99999.0 %

Ordinary least square:

-99999.0 %


DHR statistics

Temporal stability [1/decade]:


abs

rel


Weighted least square:

-99999.0


Ordinary least square:

-99999.0


Probabilities that GCOS criteria is met:

Weighted least square:

-99999.0 %

Ordinary least square:

-99999.0 %


+057/+063 deg (BHR)


BHR statistics

Temporal stability [1/decade]:


abs

rel


Weighted least square:

-0.0055674538832


Ordinary least square:

-0.0201034203365


Probabilities that GCOS criteria is met:

Weighted least square:

3.7 %

Ordinary least square:

4.5 %


DHR statistics

Temporal stability [1/decade]:


abs

rel


Weighted least square:

0.00579513313599


Ordinary least square:

-0.0186412145779


Probabilities that GCOS criteria is met:

Weighted least square:

0.0 %

Ordinary least square:

4.6 %


Temporal anomaly analyis

The variance of the temporal anomalies provides an additional measure about the stability of the signal AFTER removal of the mean seasonal cylce.
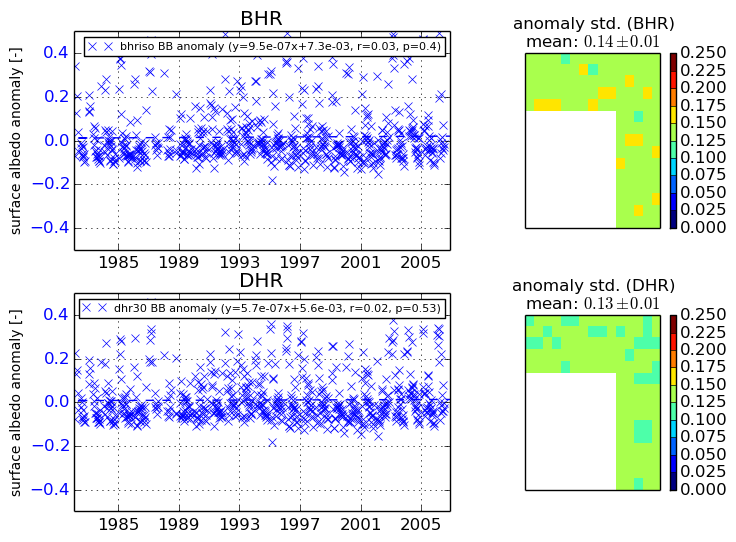
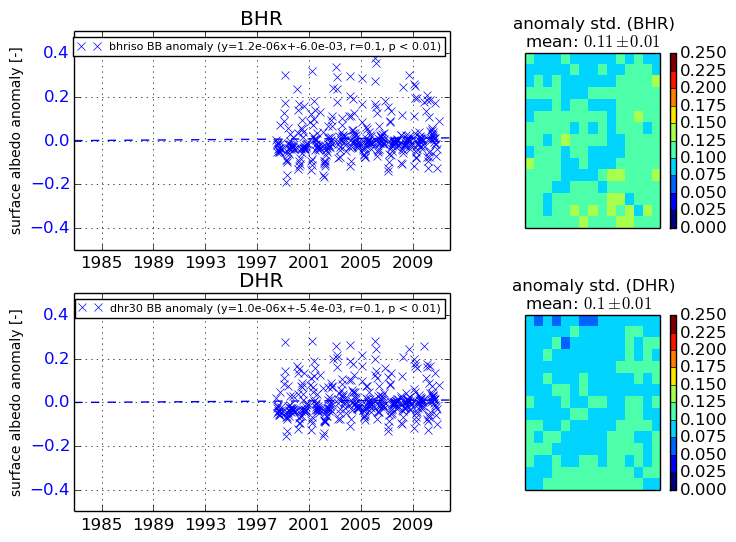
+000 deg


+057/+063 deg