DRAGON_ALDINE


Location

lon / lat [deg]: -95.3261 / 29.901

Source network: AERONET


Geostationary surface albedo (GSA) data


“+000”


“+057/+063”


Landcover information (based on ESA CCI landcover data)


Landcover fractions @ 2km distance


Landcover fractions @ 20 km distance


Legend


Distance to open water bodies [km]:

7.65

Distance to urban areas [km]:

0.05


Radius: 1 km

Number of landcover classes:

1

Dominant landcover type:

190: urban areas

Fraction of dominant landcover type [%]:

100.0


Radius: 2 km

Number of landcover classes:

2

Dominant landcover type:

190: urban areas

Fraction of dominant landcover type [%]:

88.0


Radius: 5 km

Number of landcover classes:

3

Dominant landcover type:

190: urban areas

Fraction of dominant landcover type [%]:

90.0


Radius: 10 km

Number of landcover classes:

6

Dominant landcover type:

190: urban areas

Fraction of dominant landcover type [%]:

81.0


Radius: 20 km

Number of landcover classes:

6

Dominant landcover type:

190: urban areas

Fraction of dominant landcover type [%]:

75.0


Disturbances


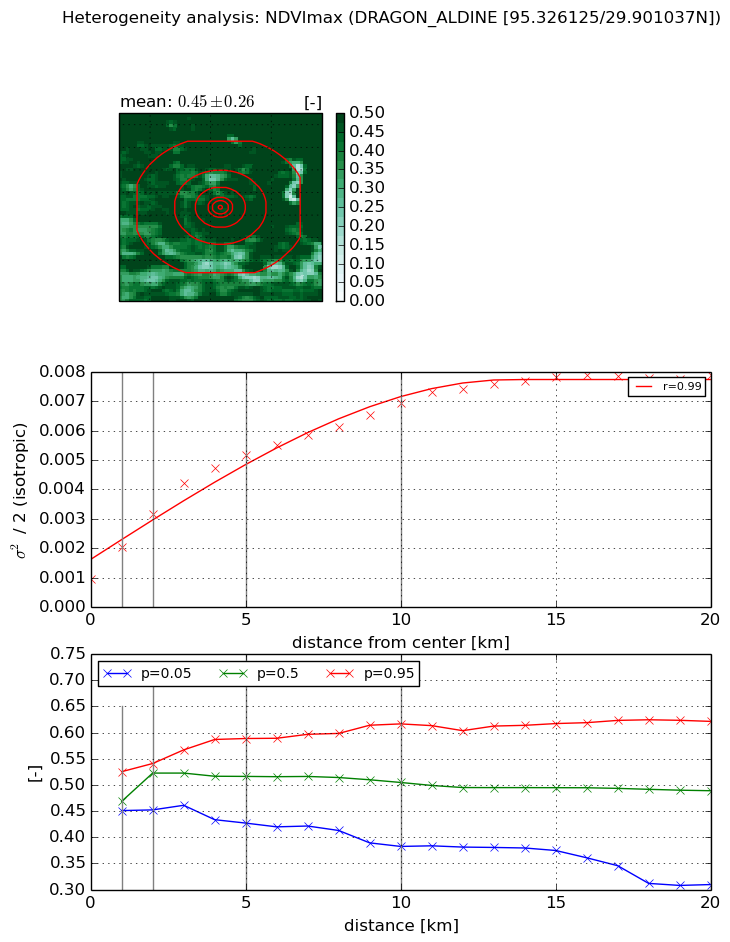
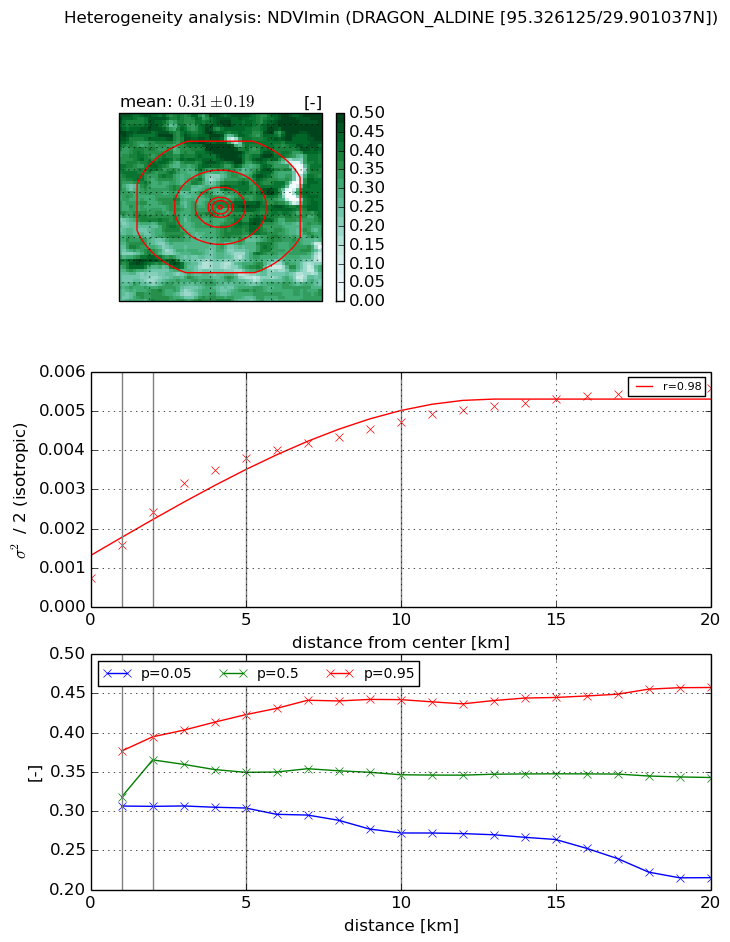
Heterogeneity analysis

The heterogeneity analysis provides information about the spatial and temporal heterogeneity of the site.

Topography


Roman et al. (2009) index


St

1.05321115826

Rcv

0.0569622687496

Rse

0.0

Rst

2.30604073277

Rsv

-0.48542865104


Height range @ 1km [m]

5

Height range @ 2km [m]

10

Height range @ 5km [m]

11

Height range @ 10km [m]

-999

Height range @ 20km [m]

-999


Variance slope @ 1 km

6

Variance slope @ 2 km

3

Variance slope @ 5 km

1

Variance slope @ 10 km

-999

Variance slope @ 20 km

-999


NDVI (max. NDVI composite)


Roman et al. (2009) index


St

nan

Rcv

nan

Rse

nan

Rst

nan

Rsv

nan


NDVI range @ 1km [-]

0.07

NDVI range @ 2km [-]

0.09

NDVI range @ 5km [-]

0.16

NDVI range @ 10km [-]

0.23

NDVI range @ 20km [-]

0.31


Variance slope @ 1 km

0.00107595538796

Variance slope @ 2 km

0.00109425497129

Variance slope @ 5 km

0.000861376388704

Variance slope @ 10 km

0.000551433851601

Variance slope @ 20 km

0.000301861318188


NDVI (min. NDVI composite)I


Roman et al. (2009) index


St

0.640770175886

Rcv

0.264337431486

Rse

0.0

Rst

-0.608522613721

Rsv

3.80900579827


NDVI range @ 1km [-]

0.07

NDVI range @ 2km [-]

0.09

NDVI range @ 5km [-]

0.12

NDVI range @ 10km [-]

0.17

NDVI range @ 20km [-]

0.24


NDVI slope @ 1 km

0.000829836059298

NDVI slope @ 2 km

0.000832353632789

NDVI slope @ 5 km

0.000620883273298

NDVI slope @ 10 km

0.000364298431322

NDVI slope @ 20 km

0.000197481774496


Temporal stability analysis

+000 deg (BHR)


BHR statistics

Temporal stability [1/decade]:


abs

rel


Weighted least square:

None


Ordinary least square:

None


Probabilities that GCOS criteria is met:

Weighted least square:

None %

Ordinary least square:

None %


DHR statistics

Temporal stability [1/decade]:


abs

rel


Weighted least square:

None


Ordinary least square:

None


Probabilities that GCOS criteria is met:

Weighted least square:

None %

Ordinary least square:

None %


+057/+063 deg (BHR)


BHR statistics

Temporal stability [1/decade]:


abs

rel


Weighted least square:

None


Ordinary least square:

None


Probabilities that GCOS criteria is met:

Weighted least square:

None %

Ordinary least square:

None %


DHR statistics

Temporal stability [1/decade]:


abs

rel


Weighted least square:

None


Ordinary least square:

None


Probabilities that GCOS criteria is met:

Weighted least square:

None %

Ordinary least square:

None %


Temporal anomaly analyis

The variance of the temporal anomalies provides an additional measure about the stability of the signal AFTER removal of the mean seasonal cylce.

+000 deg


+057/+063 deg