DRAGON_ARVIN


Location

lon / lat [deg]: -118.7878 / 35.238

Source network: AERONET


Geostationary surface albedo (GSA) data


“+000”


“+057/+063”


Landcover information (based on ESA CCI landcover data)


Landcover fractions @ 2km distance


Landcover fractions @ 20 km distance


Legend


Distance to open water bodies [km]:

1.6

Distance to urban areas [km]:

4.52


Radius: 1 km

Number of landcover classes:

2

Dominant landcover type:

130: grassland

Fraction of dominant landcover type [%]:

60.0


Radius: 2 km

Number of landcover classes:

4

Dominant landcover type:

130: grassland

Fraction of dominant landcover type [%]:

61.0


Radius: 5 km

Number of landcover classes:

7

Dominant landcover type:

10: cropland, rainfed

Fraction of dominant landcover type [%]:

55.0


Radius: 10 km

Number of landcover classes:

6

Dominant landcover type:

130: grassland

Fraction of dominant landcover type [%]:

47.0


Radius: 20 km

Number of landcover classes:

5

Dominant landcover type:

130: grassland

Fraction of dominant landcover type [%]:

51.0


Disturbances


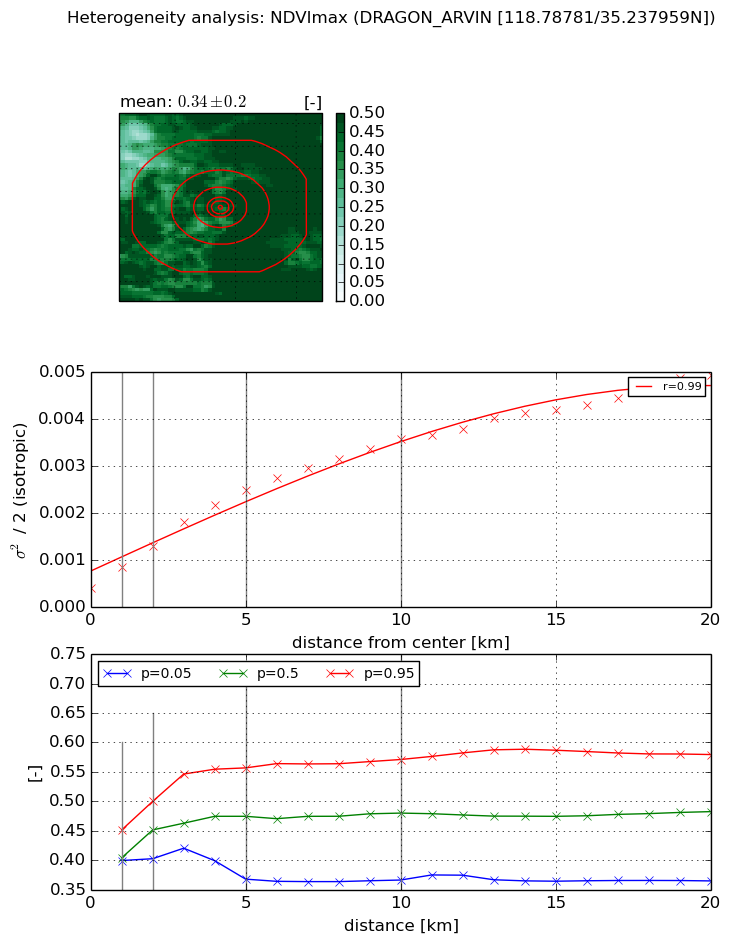
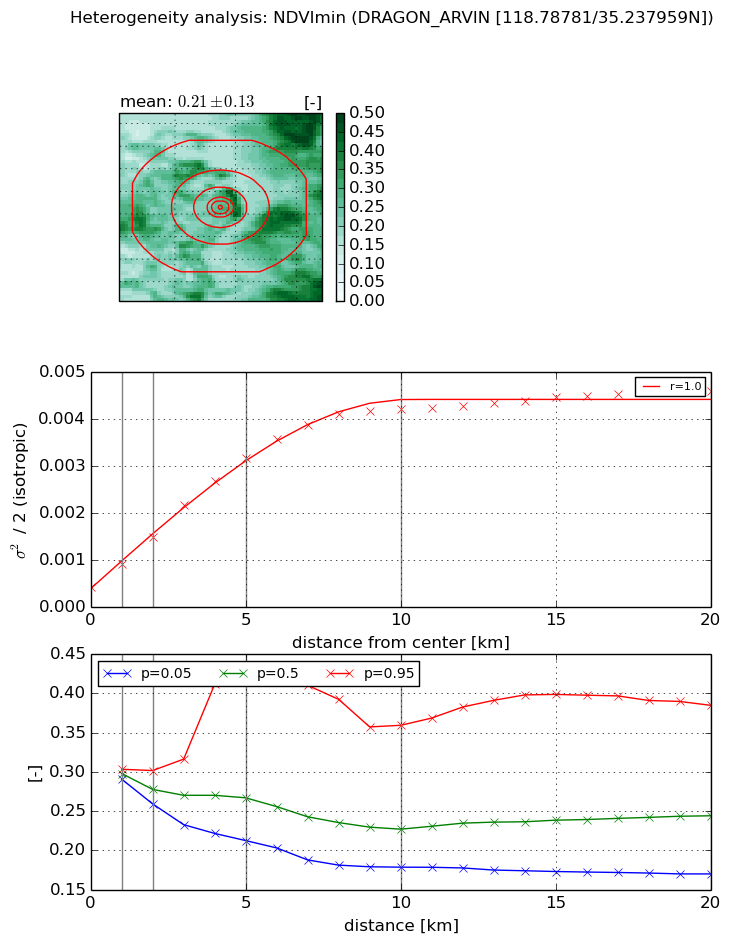
Heterogeneity analysis

The heterogeneity analysis provides information about the spatial and temporal heterogeneity of the site.

Topography


Roman et al. (2009) index


St

0.108384982631

Rcv

1.20935661549

Rse

0.0

Rst

4.00014756141e-07

Rsv

26.4697543076


Height range @ 1km [m]

11

Height range @ 2km [m]

20

Height range @ 5km [m]

79

Height range @ 10km [m]

-999

Height range @ 20km [m]

-999


Variance slope @ 1 km

141

Variance slope @ 2 km

183

Variance slope @ 5 km

224

Variance slope @ 10 km

-999

Variance slope @ 20 km

-999


NDVI (max. NDVI composite)


Roman et al. (2009) index


St

1.2442295396

Rcv

0.370779374245

Rse

0.0

Rst

-0.500852870189

Rsv

1.53949842279


NDVI range @ 1km [-]

0.05

NDVI range @ 2km [-]

0.1

NDVI range @ 5km [-]

0.19

NDVI range @ 10km [-]

0.2

NDVI range @ 20km [-]

0.21


Variance slope @ 1 km

0.000428316653414

Variance slope @ 2 km

0.000437127597504

Variance slope @ 5 km

0.000426360097929

Variance slope @ 10 km

0.000312058247286

Variance slope @ 20 km

0.00020602757671


NDVI (min. NDVI composite)I


Roman et al. (2009) index


St

0.159536190875

Rcv

1.12525679486

Rse

0.0

Rst

4.81126447657e-08

Rsv

17.6792538047


NDVI range @ 1km [-]

0.01

NDVI range @ 2km [-]

0.04

NDVI range @ 5km [-]

0.21

NDVI range @ 10km [-]

0.18

NDVI range @ 20km [-]

0.21


NDVI slope @ 1 km

0.00049618701505

NDVI slope @ 2 km

0.000532027380121

NDVI slope @ 5 km

0.000565293600689

NDVI slope @ 10 km

0.000400873638172

NDVI slope @ 20 km

0.000179430325935


Temporal stability analysis

+000 deg (BHR)


BHR statistics

Temporal stability [1/decade]:


abs

rel


Weighted least square:

None


Ordinary least square:

None


Probabilities that GCOS criteria is met:

Weighted least square:

None %

Ordinary least square:

None %


DHR statistics

Temporal stability [1/decade]:


abs

rel


Weighted least square:

None


Ordinary least square:

None


Probabilities that GCOS criteria is met:

Weighted least square:

None %

Ordinary least square:

None %


+057/+063 deg (BHR)


BHR statistics

Temporal stability [1/decade]:


abs

rel


Weighted least square:

None


Ordinary least square:

None


Probabilities that GCOS criteria is met:

Weighted least square:

None %

Ordinary least square:

None %


DHR statistics

Temporal stability [1/decade]:


abs

rel


Weighted least square:

None


Ordinary least square:

None


Probabilities that GCOS criteria is met:

Weighted least square:

None %

Ordinary least square:

None %


Temporal anomaly analyis

The variance of the temporal anomalies provides an additional measure about the stability of the signal AFTER removal of the mean seasonal cylce.

+000 deg


+057/+063 deg