DRAGON_BELTSVILLE


Location

lon / lat [deg]: -76.8775 / 39.0541

Source network: AERONET


Geostationary surface albedo (GSA) data


“+000”


“+057/+063”


Landcover information (based on ESA CCI landcover data)


Landcover fractions @ 2km distance


Landcover fractions @ 20 km distance


Legend


Distance to open water bodies [km]:

1.03

Distance to urban areas [km]:

0.33


Radius: 1 km

Number of landcover classes:

3

Dominant landcover type:

190: urban areas

Fraction of dominant landcover type [%]:

63.0


Radius: 2 km

Number of landcover classes:

4

Dominant landcover type:

190: urban areas

Fraction of dominant landcover type [%]:

66.0


Radius: 5 km

Number of landcover classes:

6

Dominant landcover type:

190: urban areas

Fraction of dominant landcover type [%]:

62.0


Radius: 10 km

Number of landcover classes:

7

Dominant landcover type:

190: urban areas

Fraction of dominant landcover type [%]:

66.0


Radius: 20 km

Number of landcover classes:

5

Dominant landcover type:

190: urban areas

Fraction of dominant landcover type [%]:

69.0


Disturbances


Heterogeneity analysis

The heterogeneity analysis provides information about the spatial and temporal heterogeneity of the site.

Topography


Roman et al. (2009) index


St

0.00200508621881

Rcv

0.469502828588

Rse

0.0

Rst

0.00826725572708

Rsv

1495.71724231


Height range @ 1km [m]

33

Height range @ 2km [m]

38

Height range @ 5km [m]

64

Height range @ 10km [m]

-999

Height range @ 20km [m]

-999


Variance slope @ 1 km

82

Variance slope @ 2 km

78

Variance slope @ 5 km

82

Variance slope @ 10 km

-999

Variance slope @ 20 km

-999


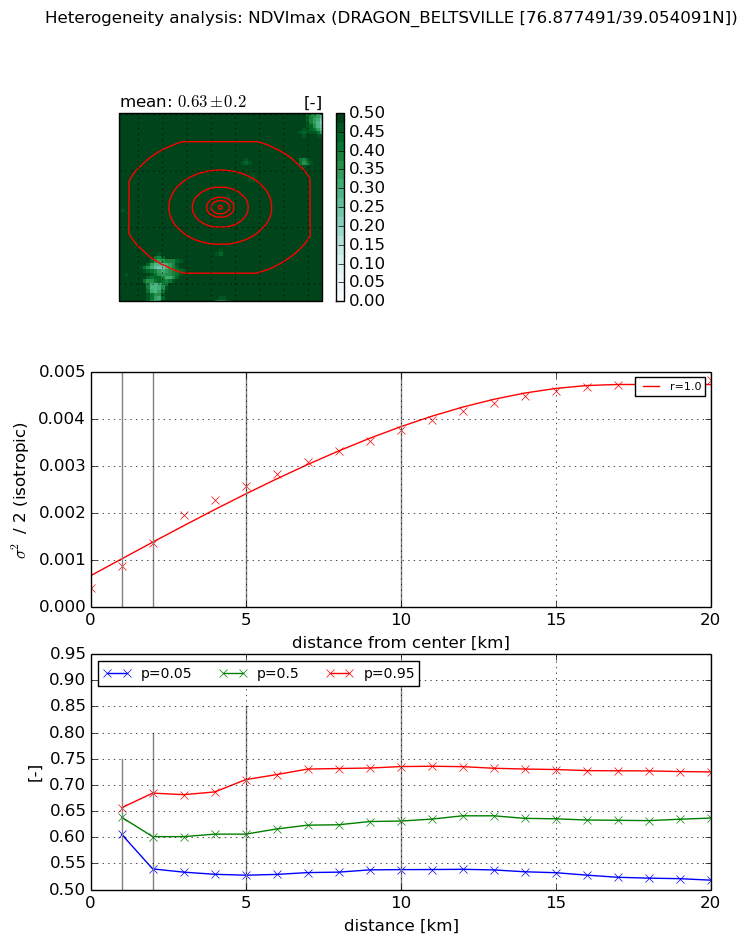
NDVI (max. NDVI composite)


Roman et al. (2009) index


St

3.02839904552e-07

Rcv

0.210349483104

Rse

0.0

Rst

0.128494284606

Rsv

9906223.89023


NDVI range @ 1km [-]

0.05

NDVI range @ 2km [-]

0.14

NDVI range @ 5km [-]

0.18

NDVI range @ 10km [-]

0.2

NDVI range @ 20km [-]

0.21


Variance slope @ 1 km

0.000463548845203

Variance slope @ 2 km

0.000480532747285

Variance slope @ 5 km

0.000446175138777

Variance slope @ 10 km

0.000327436378465

Variance slope @ 20 km

0.000211767844538


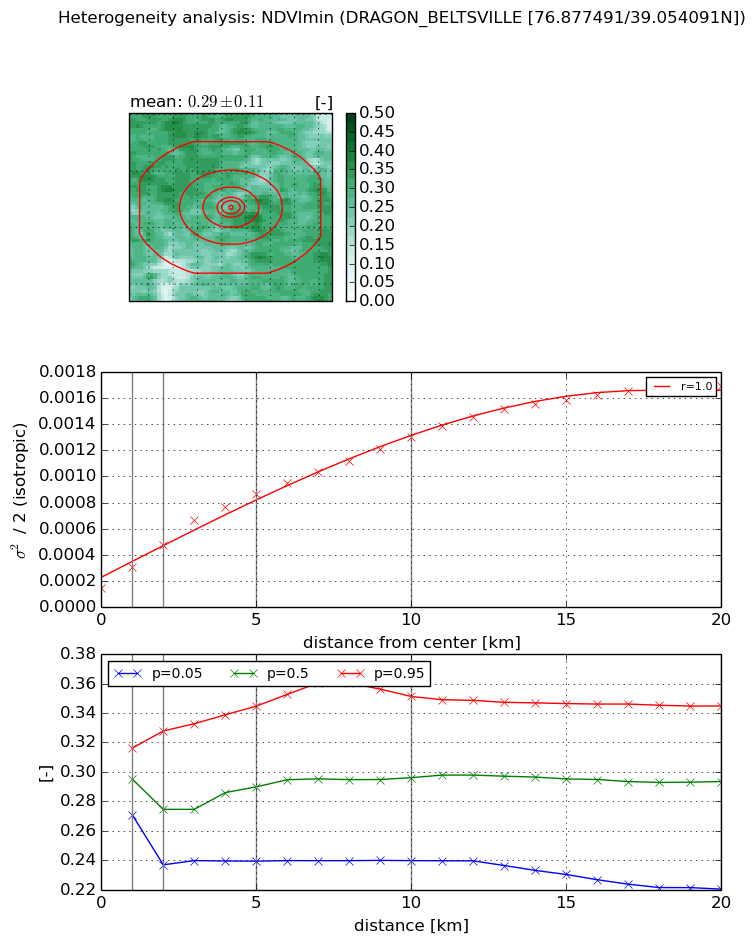
NDVI (min. NDVI composite)I


Roman et al. (2009) index


St

1.11281564898e-05

Rcv

0.0817434761281

Rse

0.0

Rst

0.120894820562

Rsv

269586.229107


NDVI range @ 1km [-]

0.05

NDVI range @ 2km [-]

0.09

NDVI range @ 5km [-]

0.11

NDVI range @ 10km [-]

0.11

NDVI range @ 20km [-]

0.12


NDVI slope @ 1 km

0.000158334411354

NDVI slope @ 2 km

0.000163585037192

NDVI slope @ 5 km

0.000148347995459

NDVI slope @ 10 km

0.000111292833102

NDVI slope @ 20 km

7.4803338622e-05


Temporal stability analysis

+000 deg (BHR)


BHR statistics

Temporal stability [1/decade]:


abs

rel


Weighted least square:

-99999.0


Ordinary least square:

-99999.0


Probabilities that GCOS criteria is met:

Weighted least square:

-99999.0 %

Ordinary least square:

-99999.0 %


DHR statistics

Temporal stability [1/decade]:


abs

rel


Weighted least square:

-99999.0


Ordinary least square:

-99999.0


Probabilities that GCOS criteria is met:

Weighted least square:

-99999.0 %

Ordinary least square:

-99999.0 %


+057/+063 deg (BHR)


BHR statistics

Temporal stability [1/decade]:


abs

rel


Weighted least square:

None


Ordinary least square:

None


Probabilities that GCOS criteria is met:

Weighted least square:

None %

Ordinary least square:

None %


DHR statistics

Temporal stability [1/decade]:


abs

rel


Weighted least square:

None


Ordinary least square:

None


Probabilities that GCOS criteria is met:

Weighted least square:

None %

Ordinary least square:

None %


Temporal anomaly analyis

The variance of the temporal anomalies provides an additional measure about the stability of the signal AFTER removal of the mean seasonal cylce.

+000 deg


+057/+063 deg