DRAGON_BOKJEONG


Location

lon / lat [deg]: 127.1312 / 37.457

Source network: AERONET


Geostationary surface albedo (GSA) data


“+000”


“+057/+063”


Landcover information (based on ESA CCI landcover data)


Landcover fractions @ 2km distance


Landcover fractions @ 20 km distance


Legend


Distance to open water bodies [km]:

1.8

Distance to urban areas [km]:

0.06


Radius: 1 km

Number of landcover classes:

3

Dominant landcover type:

190: urban areas

Fraction of dominant landcover type [%]:

79.0


Radius: 2 km

Number of landcover classes:

3

Dominant landcover type:

190: urban areas

Fraction of dominant landcover type [%]:

84.0


Radius: 5 km

Number of landcover classes:

5

Dominant landcover type:

190: urban areas

Fraction of dominant landcover type [%]:

71.0


Radius: 10 km

Number of landcover classes:

7

Dominant landcover type:

190: urban areas

Fraction of dominant landcover type [%]:

55.0


Radius: 20 km

Number of landcover classes:

6

Dominant landcover type:

190: urban areas

Fraction of dominant landcover type [%]:

47.0


Disturbances


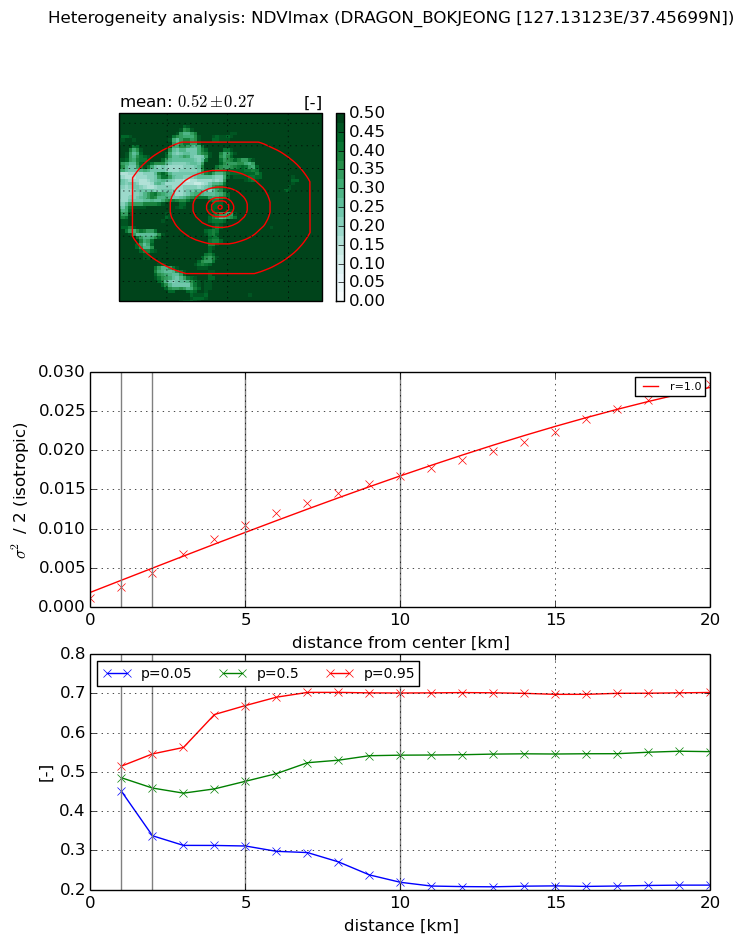
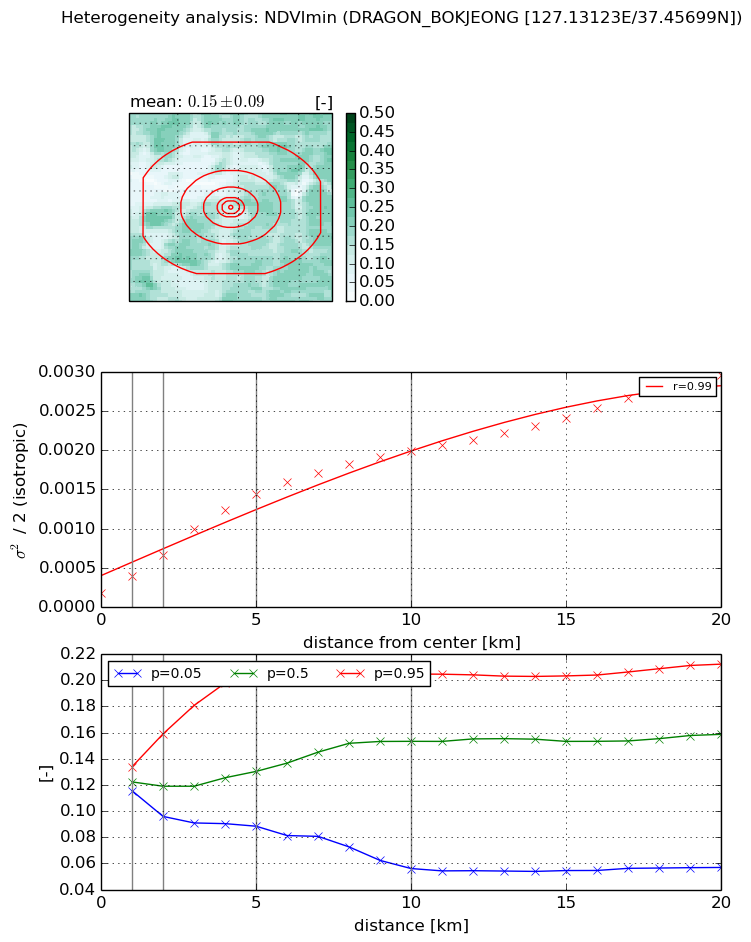
Heterogeneity analysis

The heterogeneity analysis provides information about the spatial and temporal heterogeneity of the site.

Topography


Roman et al. (2009) index


St

3.88545404204

Rcv

0.347282297671

Rse

0.0

Rst

0.00722713412503

Rsv

-0.417601103431


Height range @ 1km [m]

121

Height range @ 2km [m]

107

Height range @ 5km [m]

255

Height range @ 10km [m]

-999

Height range @ 20km [m]

-999


Variance slope @ 1 km

2276

Variance slope @ 2 km

2218

Variance slope @ 5 km

2088

Variance slope @ 10 km

-999

Variance slope @ 20 km

-999


NDVI (max. NDVI composite)


Roman et al. (2009) index


St

9.24916548831

Rcv

0.258780983933

Rse

0.0

Rst

0.0317008536898

Rsv

0.0338717490645


NDVI range @ 1km [-]

0.06

NDVI range @ 2km [-]

0.21

NDVI range @ 5km [-]

0.36

NDVI range @ 10km [-]

0.48

NDVI range @ 20km [-]

0.49


Variance slope @ 1 km

0.00146386958669

Variance slope @ 2 km

0.00160382774934

Variance slope @ 5 km

0.00193384031474

Variance slope @ 10 km

0.00161524732333

Variance slope @ 20 km

0.00132713887751


NDVI (min. NDVI composite)I


Roman et al. (2009) index


St

7.3778592184

Rcv

0.181622823281

Rse

0.0

Rst

0.0329749022252

Rsv

-0.192024291964


NDVI range @ 1km [-]

0.02

NDVI range @ 2km [-]

0.06

NDVI range @ 5km [-]

0.11

NDVI range @ 10km [-]

0.15

NDVI range @ 20km [-]

0.16


NDVI slope @ 1 km

0.000226195263732

NDVI slope @ 2 km

0.000242331150515

NDVI slope @ 5 km

0.000261999831519

NDVI slope @ 10 km

0.000185848610691

NDVI slope @ 20 km

0.000125350238812


Temporal stability analysis

+000 deg (BHR)


BHR statistics

Temporal stability [1/decade]:


abs

rel


Weighted least square:

None


Ordinary least square:

None


Probabilities that GCOS criteria is met:

Weighted least square:

None %

Ordinary least square:

None %


DHR statistics

Temporal stability [1/decade]:


abs

rel


Weighted least square:

None


Ordinary least square:

None


Probabilities that GCOS criteria is met:

Weighted least square:

None %

Ordinary least square:

None %


+057/+063 deg (BHR)


BHR statistics

Temporal stability [1/decade]:


abs

rel


Weighted least square:

-99999.0


Ordinary least square:

-99999.0


Probabilities that GCOS criteria is met:

Weighted least square:

-99999.0 %

Ordinary least square:

-99999.0 %


DHR statistics

Temporal stability [1/decade]:


abs

rel


Weighted least square:

-99999.0


Ordinary least square:

-99999.0


Probabilities that GCOS criteria is met:

Weighted least square:

-99999.0 %

Ordinary least square:

-99999.0 %


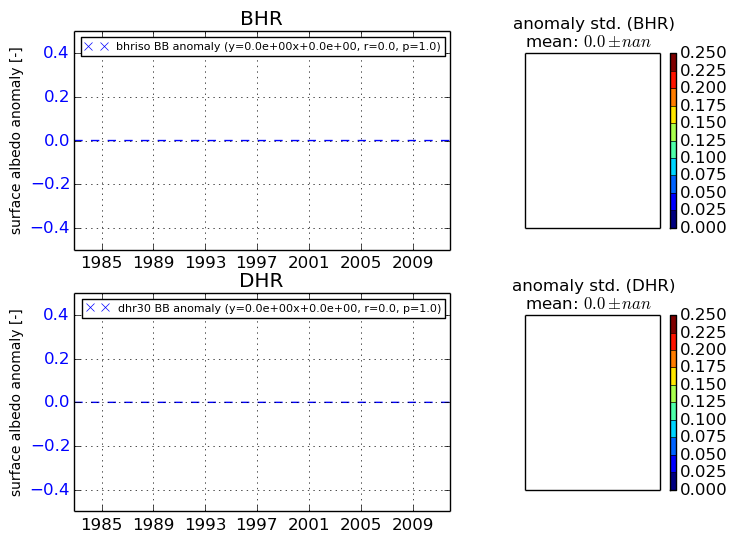
Temporal anomaly analyis

The variance of the temporal anomalies provides an additional measure about the stability of the signal AFTER removal of the mean seasonal cylce.

+000 deg


+057/+063 deg