DRAGON_BOULDER


Location

lon / lat [deg]: -105.2613 / 39.9919

Source network: AERONET


Geostationary surface albedo (GSA) data


“+000”


“+057/+063”


Landcover information (based on ESA CCI landcover data)


Landcover fractions @ 2km distance


Landcover fractions @ 20 km distance


Legend


Distance to open water bodies [km]:

4.19

Distance to urban areas [km]:

0.17


Radius: 1 km

Number of landcover classes:

1

Dominant landcover type:

190: urban areas

Fraction of dominant landcover type [%]:

100.0


Radius: 2 km

Number of landcover classes:

2

Dominant landcover type:

190: urban areas

Fraction of dominant landcover type [%]:

98.0


Radius: 5 km

Number of landcover classes:

4

Dominant landcover type:

190: urban areas

Fraction of dominant landcover type [%]:

60.0


Radius: 10 km

Number of landcover classes:

4

Dominant landcover type:

70: Tree cover, needleleaved, evergreen, closed to open (>15%)

Fraction of dominant landcover type [%]:

34.0


Radius: 20 km

Number of landcover classes:

5

Dominant landcover type:

70: Tree cover, needleleaved, evergreen, closed to open (>15%)

Fraction of dominant landcover type [%]:

40.0


Disturbances


Heterogeneity analysis

The heterogeneity analysis provides information about the spatial and temporal heterogeneity of the site.

Topography


Roman et al. (2009) index


St

1.58193753749

Rcv

0.896405426202

Rse

0.0

Rst

-3.20492582893e-06

Rsv

-0.999999999998


Height range @ 1km [m]

85

Height range @ 2km [m]

190

Height range @ 5km [m]

657

Height range @ 10km [m]

-999

Height range @ 20km [m]

-999


Variance slope @ 1 km

4564

Variance slope @ 2 km

6021

Variance slope @ 5 km

9154

Variance slope @ 10 km

-999

Variance slope @ 20 km

-999


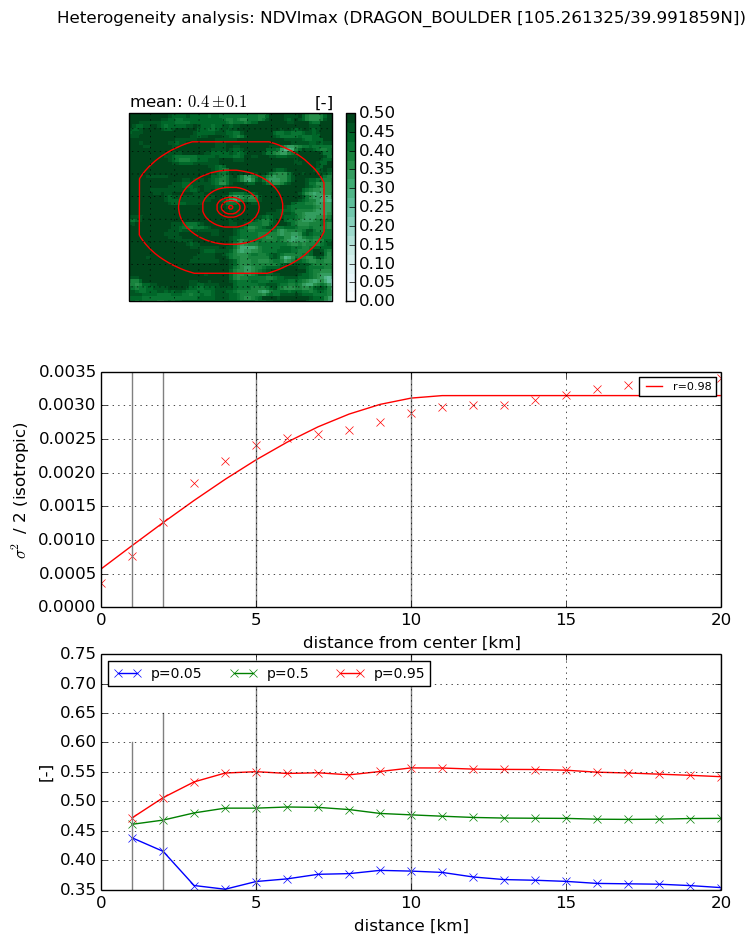
NDVI (max. NDVI composite)


Roman et al. (2009) index


St

5.8522324388

Rcv

0.0764020933574

Rse

0.0

Rst

-0.103081984997

Rsv

0.333140809903


NDVI range @ 1km [-]

0.03

NDVI range @ 2km [-]

0.09

NDVI range @ 5km [-]

0.19

NDVI range @ 10km [-]

0.18

NDVI range @ 20km [-]

0.19


Variance slope @ 1 km

0.000399967404773

Variance slope @ 2 km

0.000449056721308

Variance slope @ 5 km

0.000430306052198

Variance slope @ 10 km

0.000239993707905

Variance slope @ 20 km

0.000123278991071


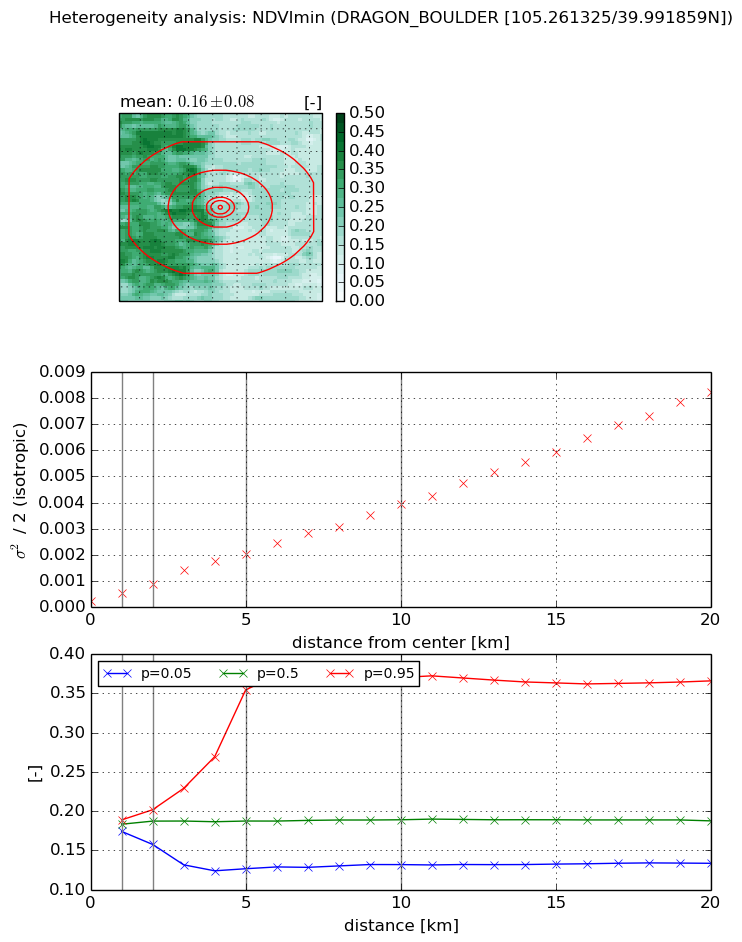
NDVI (min. NDVI composite)I


Roman et al. (2009) index


St

1.41614540066

Rcv

0.925166849583

Rse

0.0

Rst

-0.193397532755

Rsv

-0.999862156767


NDVI range @ 1km [-]

0.01

NDVI range @ 2km [-]

0.04

NDVI range @ 5km [-]

0.23

NDVI range @ 10km [-]

0.24

NDVI range @ 20km [-]

0.23


NDVI slope @ 1 km

0.000298340824486

NDVI slope @ 2 km

0.000321211770696

NDVI slope @ 5 km

0.000377751889746

NDVI slope @ 10 km

0.000368652718041

NDVI slope @ 20 km

0.000398706707898


Temporal stability analysis

+000 deg (BHR)


BHR statistics

Temporal stability [1/decade]:


abs

rel


Weighted least square:

None


Ordinary least square:

None


Probabilities that GCOS criteria is met:

Weighted least square:

None %

Ordinary least square:

None %


DHR statistics

Temporal stability [1/decade]:


abs

rel


Weighted least square:

None


Ordinary least square:

None


Probabilities that GCOS criteria is met:

Weighted least square:

None %

Ordinary least square:

None %


+057/+063 deg (BHR)


BHR statistics

Temporal stability [1/decade]:


abs

rel


Weighted least square:

None


Ordinary least square:

None


Probabilities that GCOS criteria is met:

Weighted least square:

None %

Ordinary least square:

None %


DHR statistics

Temporal stability [1/decade]:


abs

rel


Weighted least square:

None


Ordinary least square:

None


Probabilities that GCOS criteria is met:

Weighted least square:

None %

Ordinary least square:

None %


Temporal anomaly analyis

The variance of the temporal anomalies provides an additional measure about the stability of the signal AFTER removal of the mean seasonal cylce.

+000 deg


+057/+063 deg