DRAGON_CHASE


Location

lon / lat [deg]: -77.08 / 38.9786

Source network: AERONET


Geostationary surface albedo (GSA) data


“+000”


“+057/+063”


Landcover information (based on ESA CCI landcover data)


Landcover fractions @ 2km distance


Landcover fractions @ 20 km distance


Legend


Distance to open water bodies [km]:

4.73

Distance to urban areas [km]:

0.09


Radius: 1 km

Number of landcover classes:

1

Dominant landcover type:

190: urban areas

Fraction of dominant landcover type [%]:

100.0


Radius: 2 km

Number of landcover classes:

1

Dominant landcover type:

190: urban areas

Fraction of dominant landcover type [%]:

100.0


Radius: 5 km

Number of landcover classes:

1

Dominant landcover type:

190: urban areas

Fraction of dominant landcover type [%]:

99.0


Radius: 10 km

Number of landcover classes:

4

Dominant landcover type:

190: urban areas

Fraction of dominant landcover type [%]:

94.0


Radius: 20 km

Number of landcover classes:

5

Dominant landcover type:

190: urban areas

Fraction of dominant landcover type [%]:

82.0


Disturbances


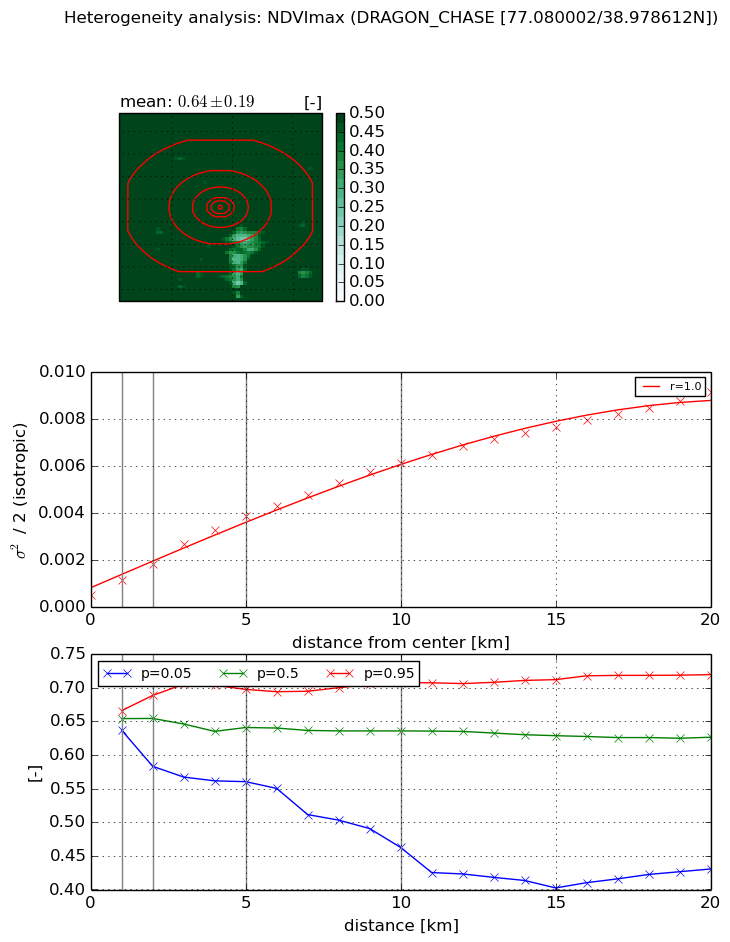
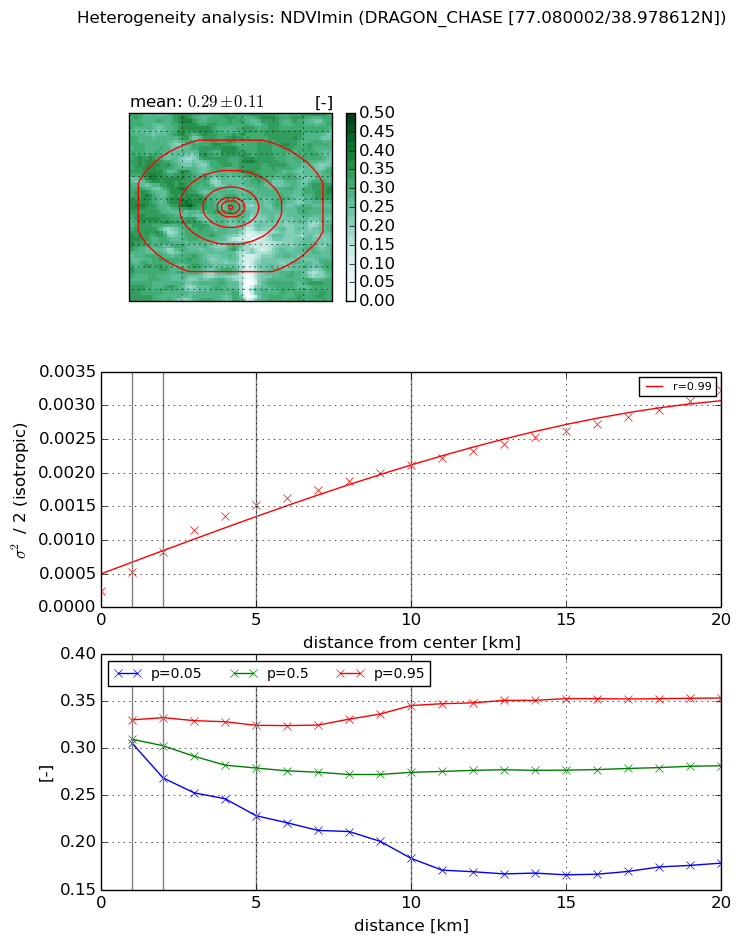
Heterogeneity analysis

The heterogeneity analysis provides information about the spatial and temporal heterogeneity of the site.

Topography


Roman et al. (2009) index


St

17.3991377551

Rcv

0.144465580305

Rse

0.0

Rst

-0.0191710047707

Rsv

-0.0087857522973


Height range @ 1km [m]

22

Height range @ 2km [m]

35

Height range @ 5km [m]

51

Height range @ 10km [m]

-999

Height range @ 20km [m]

-999


Variance slope @ 1 km

188

Variance slope @ 2 km

149

Variance slope @ 5 km

83

Variance slope @ 10 km

-999

Variance slope @ 20 km

-999


NDVI (max. NDVI composite)


Roman et al. (2009) index


St

3.64035925184

Rcv

0.0449342658993

Rse

0.0

Rst

0.434120927606

Rsv

-0.345039296203


NDVI range @ 1km [-]

0.03

NDVI range @ 2km [-]

0.11

NDVI range @ 5km [-]

0.14

NDVI range @ 10km [-]

0.25

NDVI range @ 20km [-]

0.29


Variance slope @ 1 km

0.000621969051973

Variance slope @ 2 km

0.000649380967383

Variance slope @ 5 km

0.000683172362753

Variance slope @ 10 km

0.000564092400705

Variance slope @ 20 km

0.000412347735836


NDVI (min. NDVI composite)I


Roman et al. (2009) index


St

nan

Rcv

nan

Rse

nan

Rst

nan

Rsv

nan


NDVI range @ 1km [-]

0.02

NDVI range @ 2km [-]

0.06

NDVI range @ 5km [-]

0.1

NDVI range @ 10km [-]

0.16

NDVI range @ 20km [-]

0.18


NDVI slope @ 1 km

0.000276314040089

NDVI slope @ 2 km

0.000285438688249

NDVI slope @ 5 km

0.000261994227081

NDVI slope @ 10 km

0.000181045888752

NDVI slope @ 20 km

0.000132505083357


Temporal stability analysis

+000 deg (BHR)


BHR statistics

Temporal stability [1/decade]:


abs

rel


Weighted least square:

-99999.0


Ordinary least square:

-99999.0


Probabilities that GCOS criteria is met:

Weighted least square:

-99999.0 %

Ordinary least square:

-99999.0 %


DHR statistics

Temporal stability [1/decade]:


abs

rel


Weighted least square:

-99999.0


Ordinary least square:

-99999.0


Probabilities that GCOS criteria is met:

Weighted least square:

-99999.0 %

Ordinary least square:

-99999.0 %


+057/+063 deg (BHR)


BHR statistics

Temporal stability [1/decade]:


abs

rel


Weighted least square:

None


Ordinary least square:

None


Probabilities that GCOS criteria is met:

Weighted least square:

None %

Ordinary least square:

None %


DHR statistics

Temporal stability [1/decade]:


abs

rel


Weighted least square:

None


Ordinary least square:

None


Probabilities that GCOS criteria is met:

Weighted least square:

None %

Ordinary least square:

None %


Temporal anomaly analyis

The variance of the temporal anomalies provides an additional measure about the stability of the signal AFTER removal of the mean seasonal cylce.

+000 deg


+057/+063 deg