DRAGON_CHATFIELD_PK


Location

lon / lat [deg]: -105.0704 / 39.5345

Source network: AERONET


Geostationary surface albedo (GSA) data


“+000”


“+057/+063”


Landcover information (based on ESA CCI landcover data)


Landcover fractions @ 2km distance


Landcover fractions @ 20 km distance


Legend


Distance to open water bodies [km]:

0.28

Distance to urban areas [km]:

1.0


Radius: 1 km

Number of landcover classes:

2

Dominant landcover type:

130: grassland

Fraction of dominant landcover type [%]:

62.0


Radius: 2 km

Number of landcover classes:

3

Dominant landcover type:

130: grassland

Fraction of dominant landcover type [%]:

61.0


Radius: 5 km

Number of landcover classes:

3

Dominant landcover type:

130: grassland

Fraction of dominant landcover type [%]:

59.0


Radius: 10 km

Number of landcover classes:

4

Dominant landcover type:

130: grassland

Fraction of dominant landcover type [%]:

48.0


Radius: 20 km

Number of landcover classes:

4

Dominant landcover type:

190: urban areas

Fraction of dominant landcover type [%]:

35.0


Disturbances


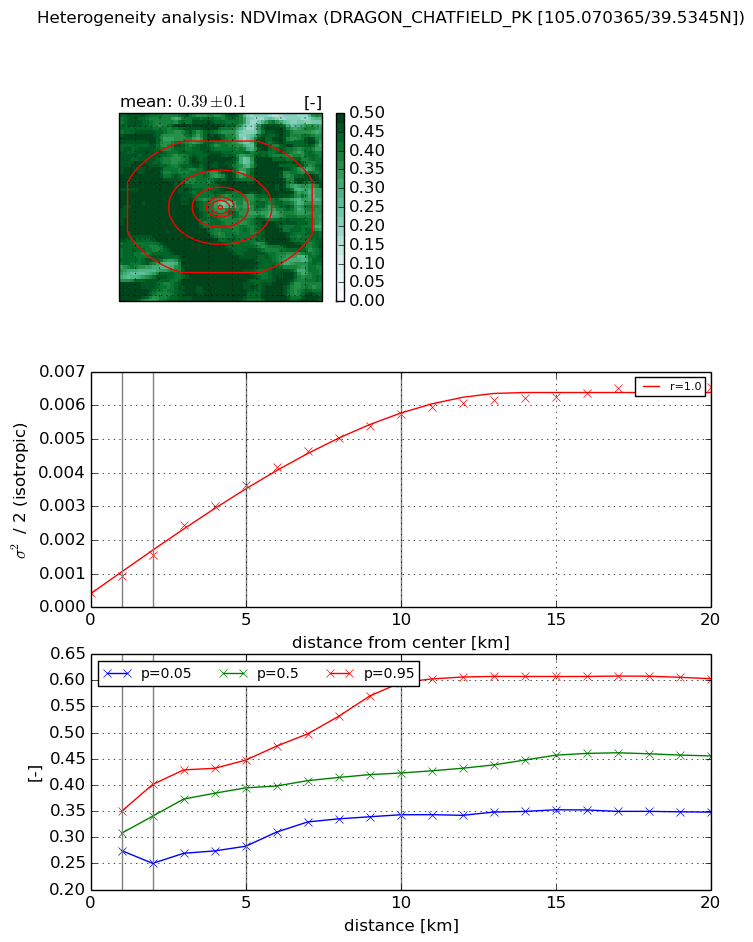
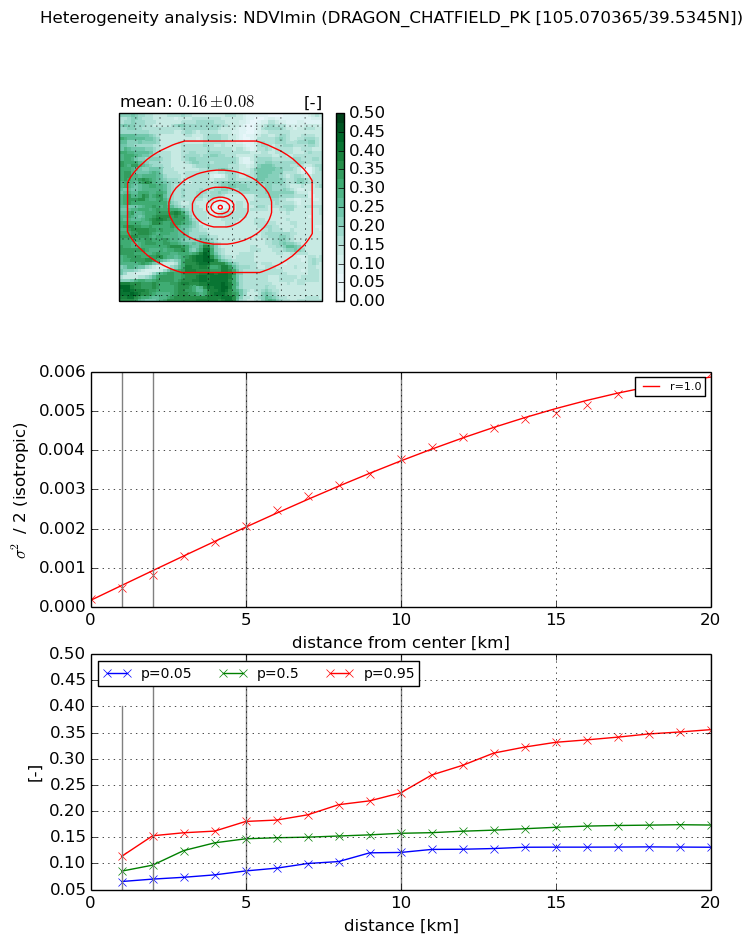
Heterogeneity analysis

The heterogeneity analysis provides information about the spatial and temporal heterogeneity of the site.

Topography


Roman et al. (2009) index


St

1.36931816123

Rcv

1.72255273337

Rse

0.0

Rst

0.0801265980227

Rsv

0.388192070841


Height range @ 1km [m]

28

Height range @ 2km [m]

36

Height range @ 5km [m]

144

Height range @ 10km [m]

-999

Height range @ 20km [m]

-999


Variance slope @ 1 km

597

Variance slope @ 2 km

637

Variance slope @ 5 km

655

Variance slope @ 10 km

-999

Variance slope @ 20 km

-999


NDVI (max. NDVI composite)


Roman et al. (2009) index


St

7.82625244869

Rcv

-0.174191731887

Rse

0.0

Rst

-0.100308659055

Rsv

0.108824836512


NDVI range @ 1km [-]

0.08

NDVI range @ 2km [-]

0.15

NDVI range @ 5km [-]

0.16

NDVI range @ 10km [-]

0.25

NDVI range @ 20km [-]

0.26


Variance slope @ 1 km

0.000523157319948

Variance slope @ 2 km

0.000561551798909

Variance slope @ 5 km

0.000659519978598

Variance slope @ 10 km

0.000549396879907

Variance slope @ 20 km

0.000297801539108


NDVI (min. NDVI composite)I


Roman et al. (2009) index


St

7.77707156704

Rcv

-0.205840476977

Rse

0.0

Rst

-0.0247705577653

Rsv

0.15513827644


NDVI range @ 1km [-]

0.05

NDVI range @ 2km [-]

0.08

NDVI range @ 5km [-]

0.09

NDVI range @ 10km [-]

0.11

NDVI range @ 20km [-]

0.22


NDVI slope @ 1 km

0.000274338721705

NDVI slope @ 2 km

0.00029715578394

NDVI slope @ 5 km

0.000378028962712

NDVI slope @ 10 km

0.000365801055453

NDVI slope @ 20 km

0.000292618558378


Temporal stability analysis

+000 deg (BHR)


BHR statistics

Temporal stability [1/decade]:


abs

rel


Weighted least square:

None


Ordinary least square:

None


Probabilities that GCOS criteria is met:

Weighted least square:

None %

Ordinary least square:

None %


DHR statistics

Temporal stability [1/decade]:


abs

rel


Weighted least square:

None


Ordinary least square:

None


Probabilities that GCOS criteria is met:

Weighted least square:

None %

Ordinary least square:

None %


+057/+063 deg (BHR)


BHR statistics

Temporal stability [1/decade]:


abs

rel


Weighted least square:

None


Ordinary least square:

None


Probabilities that GCOS criteria is met:

Weighted least square:

None %

Ordinary least square:

None %


DHR statistics

Temporal stability [1/decade]:


abs

rel


Weighted least square:

None


Ordinary least square:

None


Probabilities that GCOS criteria is met:

Weighted least square:

None %

Ordinary least square:

None %


Temporal anomaly analyis

The variance of the temporal anomalies provides an additional measure about the stability of the signal AFTER removal of the mean seasonal cylce.

+000 deg


+057/+063 deg