DRAGON_CLOVIS


Location

lon / lat [deg]: -119.7164 / 36.8193

Source network: AERONET


Geostationary surface albedo (GSA) data


“+000”


“+057/+063”


Landcover information (based on ESA CCI landcover data)


Landcover fractions @ 2km distance


Landcover fractions @ 20 km distance


Legend


Distance to open water bodies [km]:

3.35

Distance to urban areas [km]:

0.17


Radius: 1 km

Number of landcover classes:

1

Dominant landcover type:

190: urban areas

Fraction of dominant landcover type [%]:

100.0


Radius: 2 km

Number of landcover classes:

3

Dominant landcover type:

190: urban areas

Fraction of dominant landcover type [%]:

97.0


Radius: 5 km

Number of landcover classes:

4

Dominant landcover type:

190: urban areas

Fraction of dominant landcover type [%]:

91.0


Radius: 10 km

Number of landcover classes:

4

Dominant landcover type:

190: urban areas

Fraction of dominant landcover type [%]:

62.0


Radius: 20 km

Number of landcover classes:

4

Dominant landcover type:

130: grassland

Fraction of dominant landcover type [%]:

53.0


Disturbances


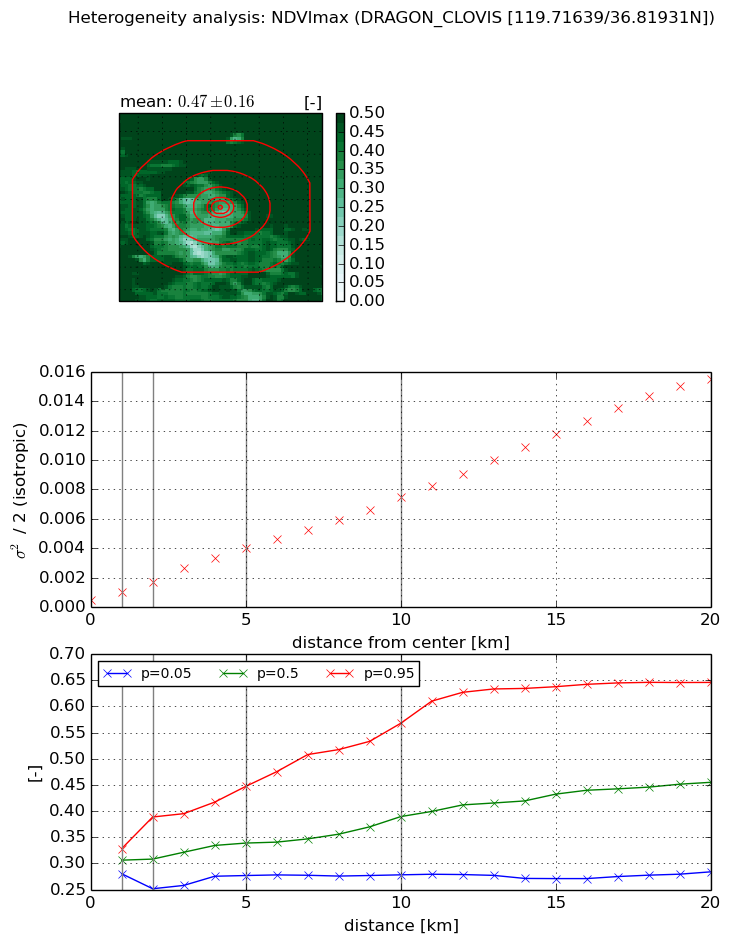
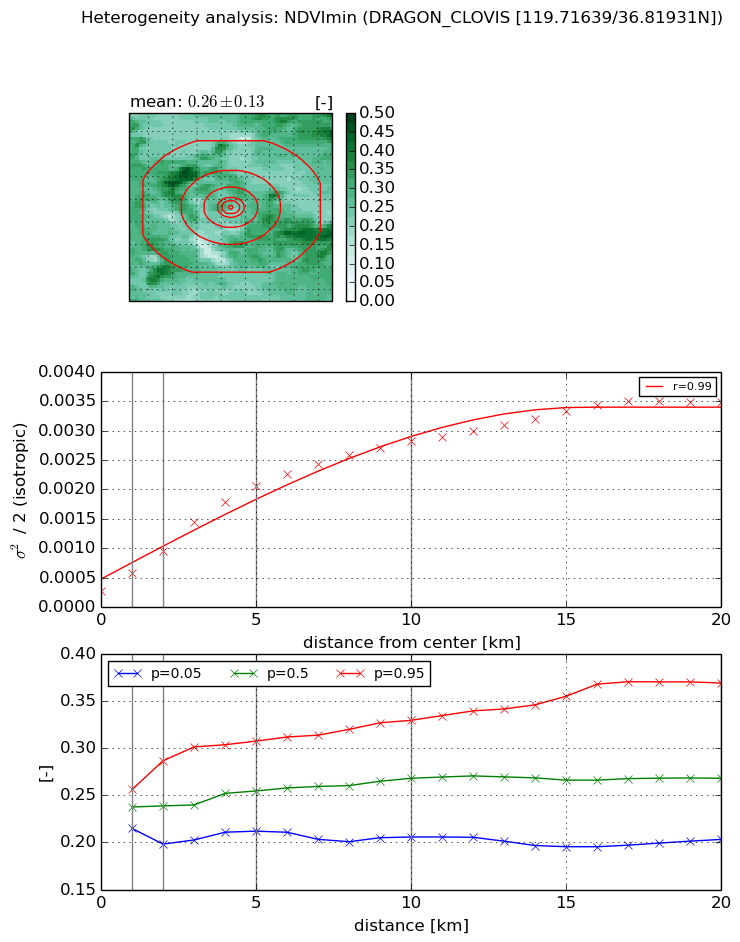
Heterogeneity analysis

The heterogeneity analysis provides information about the spatial and temporal heterogeneity of the site.

Topography


Roman et al. (2009) index


St

0.00198507484568

Rcv

0.449863150828

Rse

0.0

Rst

1.17709892943e-08

Rsv

1510.82816574


Height range @ 1km [m]

8

Height range @ 2km [m]

9

Height range @ 5km [m]

15

Height range @ 10km [m]

-999

Height range @ 20km [m]

-999


Variance slope @ 1 km

2

Variance slope @ 2 km

2

Variance slope @ 5 km

4

Variance slope @ 10 km

-999

Variance slope @ 20 km

-999


NDVI (max. NDVI composite)


Roman et al. (2009) index


St

2.17688537627

Rcv

0.103971912619

Rse

0.0

Rst

-0.274143937361

Rsv

-0.999999889464


NDVI range @ 1km [-]

0.05

NDVI range @ 2km [-]

0.14

NDVI range @ 5km [-]

0.17

NDVI range @ 10km [-]

0.29

NDVI range @ 20km [-]

0.36


Variance slope @ 1 km

0.000559920869158

Variance slope @ 2 km

0.00062433644136

Variance slope @ 5 km

0.000735409568026

Variance slope @ 10 km

0.000696289514757

Variance slope @ 20 km

0.000773720902894


NDVI (min. NDVI composite)I


Roman et al. (2009) index


St

2.23796127029

Rcv

-0.0569867657353

Rse

0.0

Rst

-0.283523295473

Rsv

-0.999995710642


NDVI range @ 1km [-]

0.04

NDVI range @ 2km [-]

0.09

NDVI range @ 5km [-]

0.1

NDVI range @ 10km [-]

0.12

NDVI range @ 20km [-]

0.17


NDVI slope @ 1 km

0.000316962651622

NDVI slope @ 2 km

0.000344970004378

NDVI slope @ 5 km

0.000371854281611

NDVI slope @ 10 km

0.000259257200196

NDVI slope @ 20 km

0.00015060182458


Temporal stability analysis

+000 deg (BHR)


BHR statistics

Temporal stability [1/decade]:


abs

rel


Weighted least square:

None


Ordinary least square:

None


Probabilities that GCOS criteria is met:

Weighted least square:

None %

Ordinary least square:

None %


DHR statistics

Temporal stability [1/decade]:


abs

rel


Weighted least square:

None


Ordinary least square:

None


Probabilities that GCOS criteria is met:

Weighted least square:

None %

Ordinary least square:

None %


+057/+063 deg (BHR)


BHR statistics

Temporal stability [1/decade]:


abs

rel


Weighted least square:

None


Ordinary least square:

None


Probabilities that GCOS criteria is met:

Weighted least square:

None %

Ordinary least square:

None %


DHR statistics

Temporal stability [1/decade]:


abs

rel


Weighted least square:

None


Ordinary least square:

None


Probabilities that GCOS criteria is met:

Weighted least square:

None %

Ordinary least square:

None %


Temporal anomaly analyis

The variance of the temporal anomalies provides an additional measure about the stability of the signal AFTER removal of the mean seasonal cylce.

+000 deg


+057/+063 deg