DRAGON_CONROE


Location

lon / lat [deg]: -95.425 / 30.3503

Source network: AERONET


Geostationary surface albedo (GSA) data


“+000”


“+057/+063”


Landcover information (based on ESA CCI landcover data)


Landcover fractions @ 2km distance


Landcover fractions @ 20 km distance


Legend


Distance to open water bodies [km]:

3.59

Distance to urban areas [km]:

0.18


Radius: 1 km

Number of landcover classes:

3

Dominant landcover type:

190: urban areas

Fraction of dominant landcover type [%]:

87.0


Radius: 2 km

Number of landcover classes:

5

Dominant landcover type:

190: urban areas

Fraction of dominant landcover type [%]:

62.0


Radius: 5 km

Number of landcover classes:

4

Dominant landcover type:

70: Tree cover, needleleaved, evergreen, closed to open (>15%)

Fraction of dominant landcover type [%]:

37.0


Radius: 10 km

Number of landcover classes:

6

Dominant landcover type:

70: Tree cover, needleleaved, evergreen, closed to open (>15%)

Fraction of dominant landcover type [%]:

48.0


Radius: 20 km

Number of landcover classes:

7

Dominant landcover type:

70: Tree cover, needleleaved, evergreen, closed to open (>15%)

Fraction of dominant landcover type [%]:

49.0


Disturbances


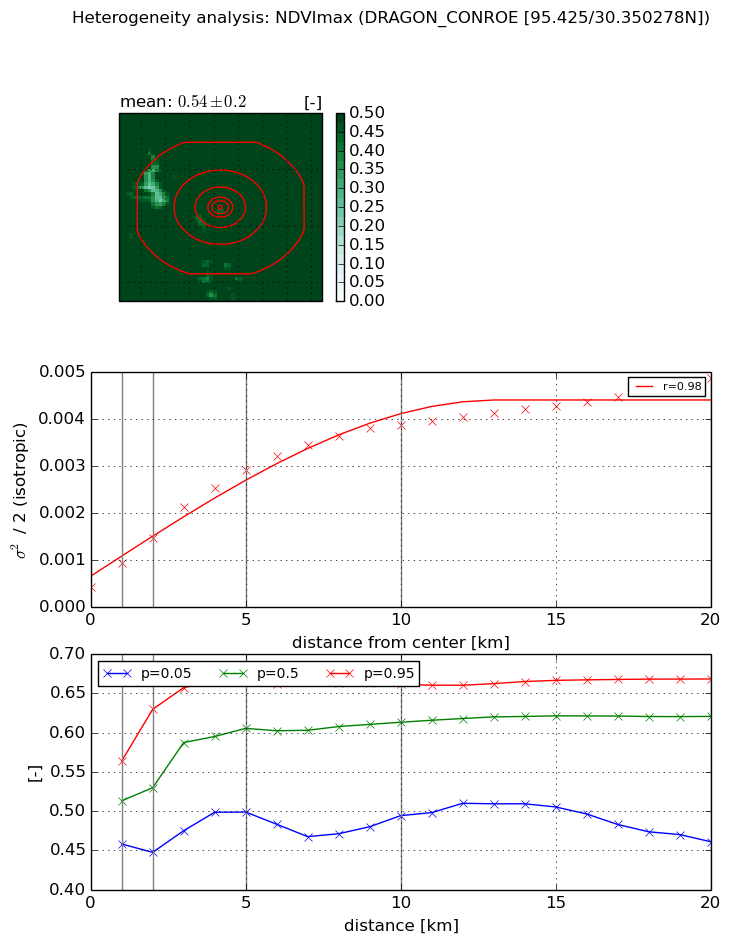
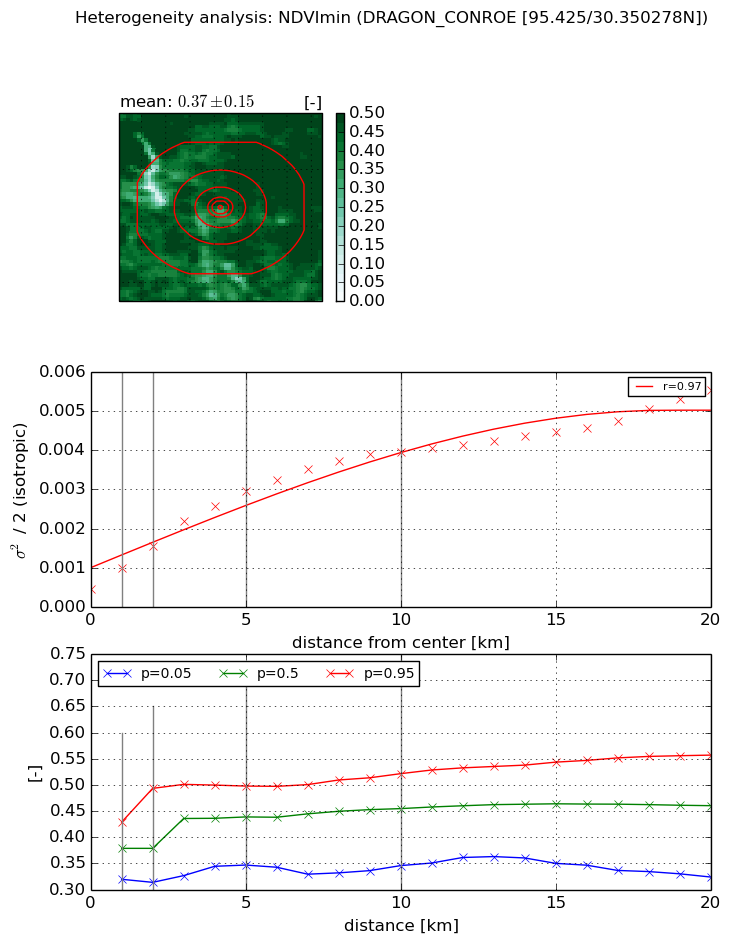
Heterogeneity analysis

The heterogeneity analysis provides information about the spatial and temporal heterogeneity of the site.

Topography


Roman et al. (2009) index


St

2.08625456309

Rcv

0.437981235734

Rse

0.0

Rst

2.43866540533e-06

Rsv

-0.999999998864


Height range @ 1km [m]

13

Height range @ 2km [m]

20

Height range @ 5km [m]

27

Height range @ 10km [m]

-999

Height range @ 20km [m]

-999


Variance slope @ 1 km

20

Variance slope @ 2 km

15

Variance slope @ 5 km

12

Variance slope @ 10 km

-999

Variance slope @ 20 km

-999


NDVI (max. NDVI composite)


Roman et al. (2009) index


St

2.17135029067

Rcv

-0.0970893555026

Rse

0.0

Rst

-0.292594685598

Rsv

0.991944714465


NDVI range @ 1km [-]

0.11

NDVI range @ 2km [-]

0.18

NDVI range @ 5km [-]

0.17

NDVI range @ 10km [-]

0.17

NDVI range @ 20km [-]

0.21


Variance slope @ 1 km

0.000499384256948

Variance slope @ 2 km

0.000520745459513

Variance slope @ 5 km

0.00051023592245

Variance slope @ 10 km

0.000350225439886

Variance slope @ 20 km

0.00018884368791


NDVI (min. NDVI composite)I


Roman et al. (2009) index


St

3.36412031913

Rcv

-0.176277986751

Rse

0.0

Rst

-0.193568681027

Rsv

0.521916918362


NDVI range @ 1km [-]

0.11

NDVI range @ 2km [-]

0.18

NDVI range @ 5km [-]

0.15

NDVI range @ 10km [-]

0.18

NDVI range @ 20km [-]

0.23


NDVI slope @ 1 km

0.000533984776216

NDVI slope @ 2 km

0.000545662828316

NDVI slope @ 5 km

0.000511601245994

NDVI slope @ 10 km

0.000354534498936

NDVI slope @ 20 km

0.000211361432692


Temporal stability analysis

+000 deg (BHR)


BHR statistics

Temporal stability [1/decade]:


abs

rel


Weighted least square:

None


Ordinary least square:

None


Probabilities that GCOS criteria is met:

Weighted least square:

None %

Ordinary least square:

None %


DHR statistics

Temporal stability [1/decade]:


abs

rel


Weighted least square:

None


Ordinary least square:

None


Probabilities that GCOS criteria is met:

Weighted least square:

None %

Ordinary least square:

None %


+057/+063 deg (BHR)


BHR statistics

Temporal stability [1/decade]:


abs

rel


Weighted least square:

None


Ordinary least square:

None


Probabilities that GCOS criteria is met:

Weighted least square:

None %

Ordinary least square:

None %


DHR statistics

Temporal stability [1/decade]:


abs

rel


Weighted least square:

None


Ordinary least square:

None


Probabilities that GCOS criteria is met:

Weighted least square:

None %

Ordinary least square:

None %


Temporal anomaly analyis

The variance of the temporal anomalies provides an additional measure about the stability of the signal AFTER removal of the mean seasonal cylce.

+000 deg


+057/+063 deg