DRAGON_DENVERLACASA


Location

lon / lat [deg]: -105.0052 / 39.7795

Source network: AERONET


Geostationary surface albedo (GSA) data


“+000”


“+057/+063”


Landcover information (based on ESA CCI landcover data)


Landcover fractions @ 2km distance


Landcover fractions @ 20 km distance


Legend


Distance to open water bodies [km]:

2.07

Distance to urban areas [km]:

0.09


Radius: 1 km

Number of landcover classes:

1

Dominant landcover type:

190: urban areas

Fraction of dominant landcover type [%]:

100.0


Radius: 2 km

Number of landcover classes:

1

Dominant landcover type:

190: urban areas

Fraction of dominant landcover type [%]:

100.0


Radius: 5 km

Number of landcover classes:

1

Dominant landcover type:

190: urban areas

Fraction of dominant landcover type [%]:

99.0


Radius: 10 km

Number of landcover classes:

1

Dominant landcover type:

190: urban areas

Fraction of dominant landcover type [%]:

99.0


Radius: 20 km

Number of landcover classes:

3

Dominant landcover type:

190: urban areas

Fraction of dominant landcover type [%]:

77.0


Disturbances


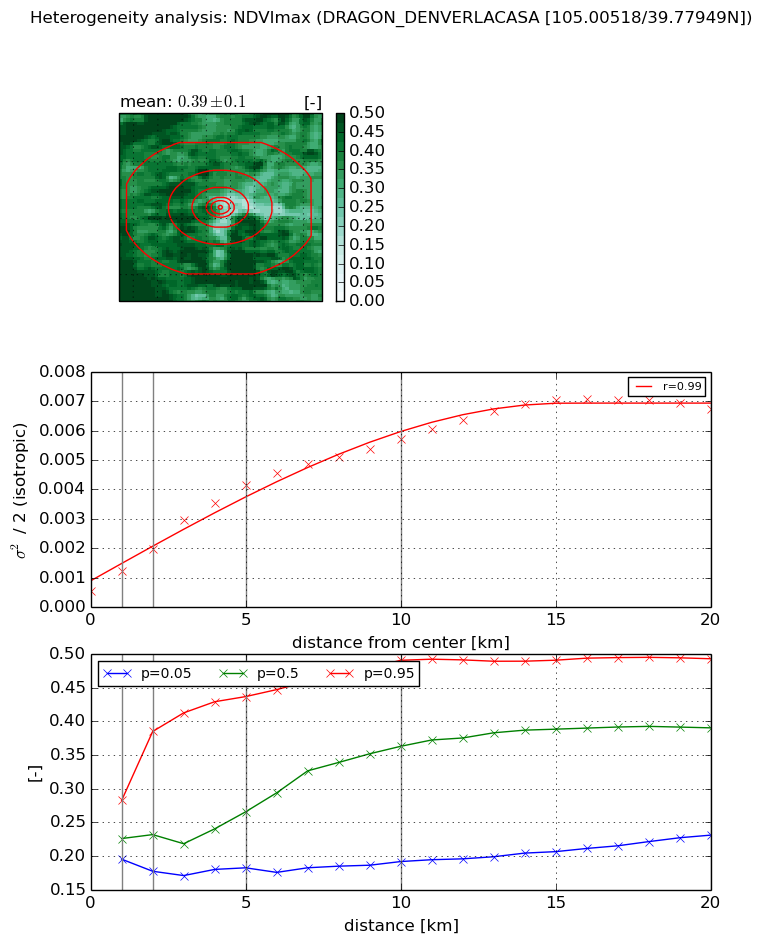
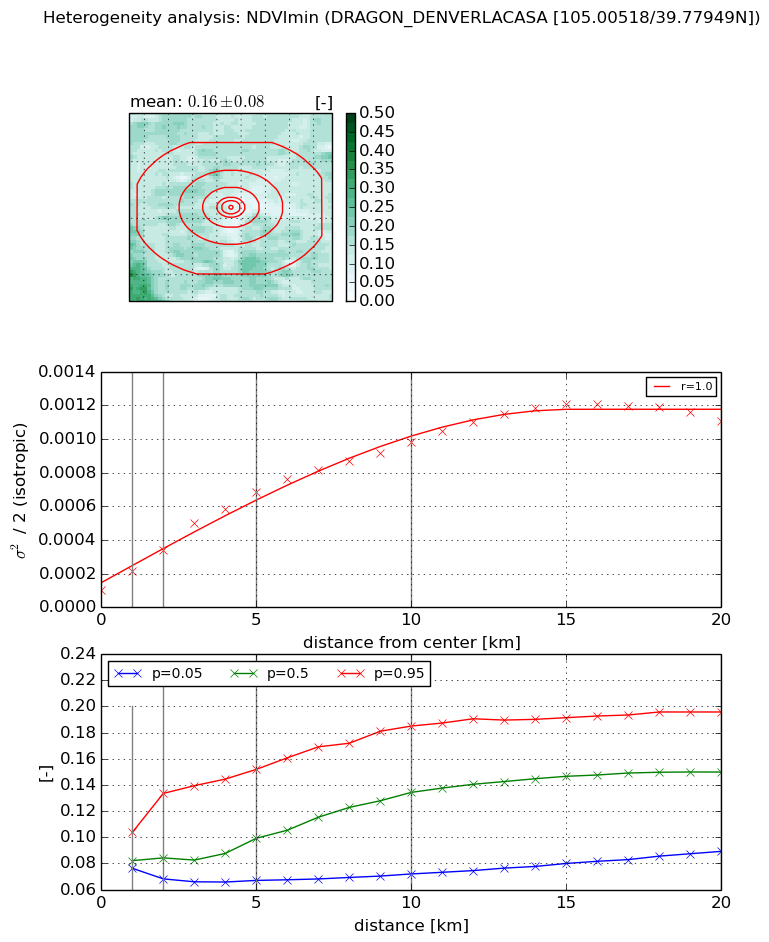
Heterogeneity analysis

The heterogeneity analysis provides information about the spatial and temporal heterogeneity of the site.

Topography


Roman et al. (2009) index


St

3.27742952682

Rcv

0.168984093753

Rse

0.0

Rst

-0.013275395307

Rsv

0.733092000714


Height range @ 1km [m]

22

Height range @ 2km [m]

49

Height range @ 5km [m]

73

Height range @ 10km [m]

-999

Height range @ 20km [m]

-999


Variance slope @ 1 km

122

Variance slope @ 2 km

167

Variance slope @ 5 km

167

Variance slope @ 10 km

-999

Variance slope @ 20 km

-999


NDVI (max. NDVI composite)


Roman et al. (2009) index


St

12.7516481939

Rcv

-0.0250012435102

Rse

0.0

Rst

-0.0477913385967

Rsv

0.162471122975


NDVI range @ 1km [-]

0.09

NDVI range @ 2km [-]

0.21

NDVI range @ 5km [-]

0.25

NDVI range @ 10km [-]

0.3

NDVI range @ 20km [-]

0.26


Variance slope @ 1 km

0.000663913335858

Variance slope @ 2 km

0.000706193561109

Variance slope @ 5 km

0.000736795592479

Variance slope @ 10 km

0.000514722450929

Variance slope @ 20 km

0.000306776539372


NDVI (min. NDVI composite)I


Roman et al. (2009) index


St

10.8851743355

Rcv

0.0438867249961

Rse

0.0

Rst

-0.0617422800601

Rsv

0.16997521657


NDVI range @ 1km [-]

0.03

NDVI range @ 2km [-]

0.07

NDVI range @ 5km [-]

0.08

NDVI range @ 10km [-]

0.11

NDVI range @ 20km [-]

0.11


NDVI slope @ 1 km

0.000113203207606

NDVI slope @ 2 km

0.000119531827773

NDVI slope @ 5 km

0.000119466926514

NDVI slope @ 10 km

8.74188185998e-05

NDVI slope @ 20 km

5.19382385475e-05


Temporal stability analysis

+000 deg (BHR)


BHR statistics

Temporal stability [1/decade]:


abs

rel


Weighted least square:

None


Ordinary least square:

None


Probabilities that GCOS criteria is met:

Weighted least square:

None %

Ordinary least square:

None %


DHR statistics

Temporal stability [1/decade]:


abs

rel


Weighted least square:

None


Ordinary least square:

None


Probabilities that GCOS criteria is met:

Weighted least square:

None %

Ordinary least square:

None %


+057/+063 deg (BHR)


BHR statistics

Temporal stability [1/decade]:


abs

rel


Weighted least square:

None


Ordinary least square:

None


Probabilities that GCOS criteria is met:

Weighted least square:

None %

Ordinary least square:

None %


DHR statistics

Temporal stability [1/decade]:


abs

rel


Weighted least square:

None


Ordinary least square:

None


Probabilities that GCOS criteria is met:

Weighted least square:

None %

Ordinary least square:

None %


Temporal anomaly analyis

The variance of the temporal anomalies provides an additional measure about the stability of the signal AFTER removal of the mean seasonal cylce.

+000 deg


+057/+063 deg