DRAGON_ELLCT


Location

lon / lat [deg]: -76.8616 / 39.2661

Source network: AERONET


Geostationary surface albedo (GSA) data


“+000”


“+057/+063”


Landcover information (based on ESA CCI landcover data)


Landcover fractions @ 2km distance


Landcover fractions @ 20 km distance


Legend


Distance to open water bodies [km]:

2.6

Distance to urban areas [km]:

0.12


Radius: 1 km

Number of landcover classes:

3

Dominant landcover type:

190: urban areas

Fraction of dominant landcover type [%]:

85.0


Radius: 2 km

Number of landcover classes:

3

Dominant landcover type:

190: urban areas

Fraction of dominant landcover type [%]:

64.0


Radius: 5 km

Number of landcover classes:

6

Dominant landcover type:

190: urban areas

Fraction of dominant landcover type [%]:

57.0


Radius: 10 km

Number of landcover classes:

6

Dominant landcover type:

190: urban areas

Fraction of dominant landcover type [%]:

45.0


Radius: 20 km

Number of landcover classes:

7

Dominant landcover type:

190: urban areas

Fraction of dominant landcover type [%]:

46.0


Disturbances


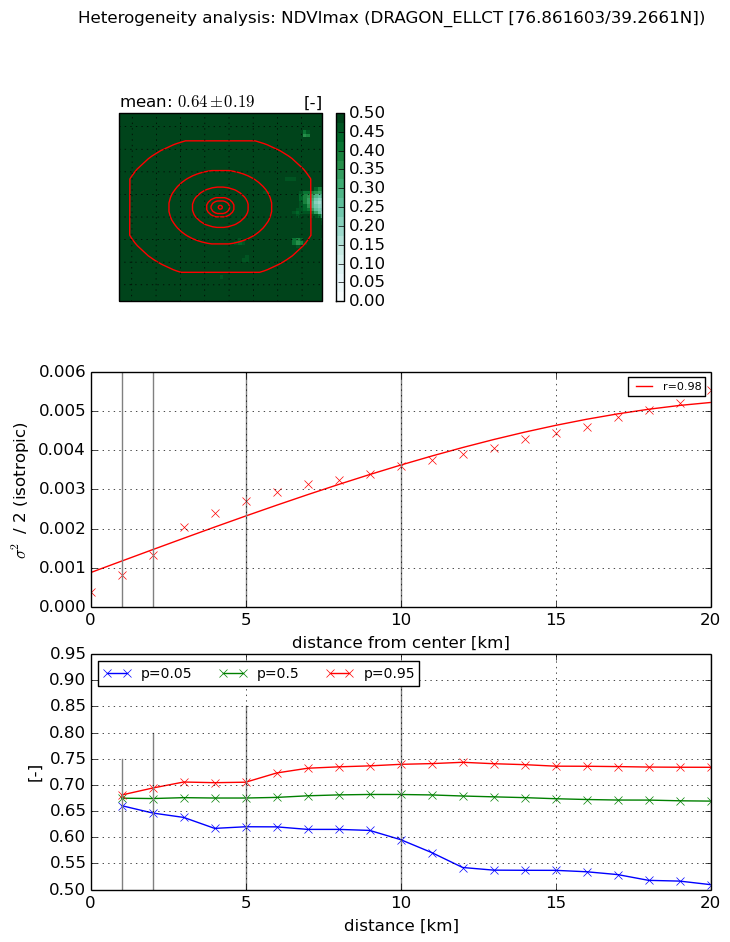
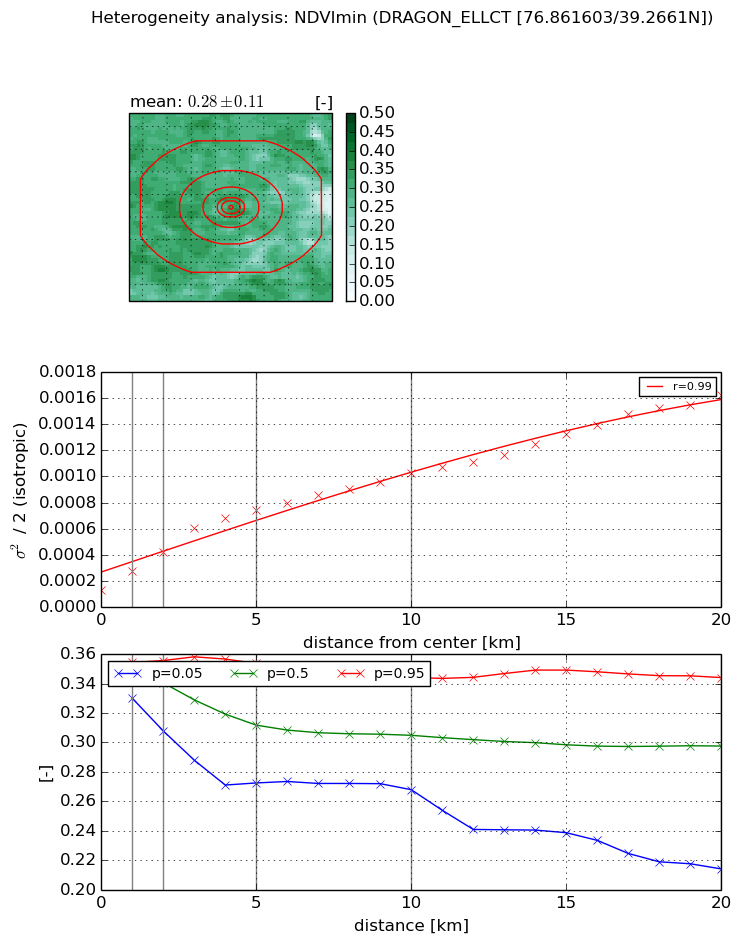
Heterogeneity analysis

The heterogeneity analysis provides information about the spatial and temporal heterogeneity of the site.

Topography


Roman et al. (2009) index


St

17.6281480941

Rcv

0.0701489832474

Rse

0.0

Rst

-0.056574673694

Rsv

0.043458711847


Height range @ 1km [m]

34

Height range @ 2km [m]

41

Height range @ 5km [m]

44

Height range @ 10km [m]

-999

Height range @ 20km [m]

-999


Variance slope @ 1 km

106

Variance slope @ 2 km

78

Variance slope @ 5 km

40

Variance slope @ 10 km

-999

Variance slope @ 20 km

-999


NDVI (max. NDVI composite)


Roman et al. (2009) index


St

2.40670453725

Rcv

0.251977827913

Rse

0.0

Rst

-0.274420752804

Rsv

0.720119200576


NDVI range @ 1km [-]

0.02

NDVI range @ 2km [-]

0.05

NDVI range @ 5km [-]

0.09

NDVI range @ 10km [-]

0.14

NDVI range @ 20km [-]

0.22


Variance slope @ 1 km

0.000447965531272

Variance slope @ 2 km

0.000482677620358

Variance slope @ 5 km

0.000488042005094

Variance slope @ 10 km

0.000315874963318

Variance slope @ 20 km

0.000223398525238


NDVI (min. NDVI composite)I


Roman et al. (2009) index


St

6.05809035334

Rcv

0.168182716024

Rse

0.0

Rst

0.0889894748763

Rsv

-0.238033364815


NDVI range @ 1km [-]

0.02

NDVI range @ 2km [-]

0.05

NDVI range @ 5km [-]

0.08

NDVI range @ 10km [-]

0.08

NDVI range @ 20km [-]

0.13


NDVI slope @ 1 km

0.000144295821596

NDVI slope @ 2 km

0.000147834939855

NDVI slope @ 5 km

0.000127666641913

NDVI slope @ 10 km

8.42801037495e-05

NDVI slope @ 20 km

6.71571940481e-05


Temporal stability analysis

+000 deg (BHR)


BHR statistics

Temporal stability [1/decade]:


abs

rel


Weighted least square:

-99999.0


Ordinary least square:

-99999.0


Probabilities that GCOS criteria is met:

Weighted least square:

-99999.0 %

Ordinary least square:

-99999.0 %


DHR statistics

Temporal stability [1/decade]:


abs

rel


Weighted least square:

-99999.0


Ordinary least square:

-99999.0


Probabilities that GCOS criteria is met:

Weighted least square:

-99999.0 %

Ordinary least square:

-99999.0 %


+057/+063 deg (BHR)


BHR statistics

Temporal stability [1/decade]:


abs

rel


Weighted least square:

None


Ordinary least square:

None


Probabilities that GCOS criteria is met:

Weighted least square:

None %

Ordinary least square:

None %


DHR statistics

Temporal stability [1/decade]:


abs

rel


Weighted least square:

None


Ordinary least square:

None


Probabilities that GCOS criteria is met:

Weighted least square:

None %

Ordinary least square:

None %


Temporal anomaly analyis

The variance of the temporal anomalies provides an additional measure about the stability of the signal AFTER removal of the mean seasonal cylce.

+000 deg


+057/+063 deg