DRAGON_GWANGJU_GIST


Location

lon / lat [deg]: 126.8431 / 35.2283

Source network: AERONET


Geostationary surface albedo (GSA) data


“+000”


“+057/+063”


Landcover information (based on ESA CCI landcover data)


Landcover fractions @ 2km distance


Landcover fractions @ 20 km distance


Legend


Distance to open water bodies [km]:

4.8

Distance to urban areas [km]:

0.21


Radius: 1 km

Number of landcover classes:

4

Dominant landcover type:

190: urban areas

Fraction of dominant landcover type [%]:

55.0


Radius: 2 km

Number of landcover classes:

4

Dominant landcover type:

190: urban areas

Fraction of dominant landcover type [%]:

47.0


Radius: 5 km

Number of landcover classes:

4

Dominant landcover type:

10: cropland, rainfed

Fraction of dominant landcover type [%]:

51.0


Radius: 10 km

Number of landcover classes:

8

Dominant landcover type:

10: cropland, rainfed

Fraction of dominant landcover type [%]:

41.0


Radius: 20 km

Number of landcover classes:

9

Dominant landcover type:

10: cropland, rainfed

Fraction of dominant landcover type [%]:

45.0


Disturbances


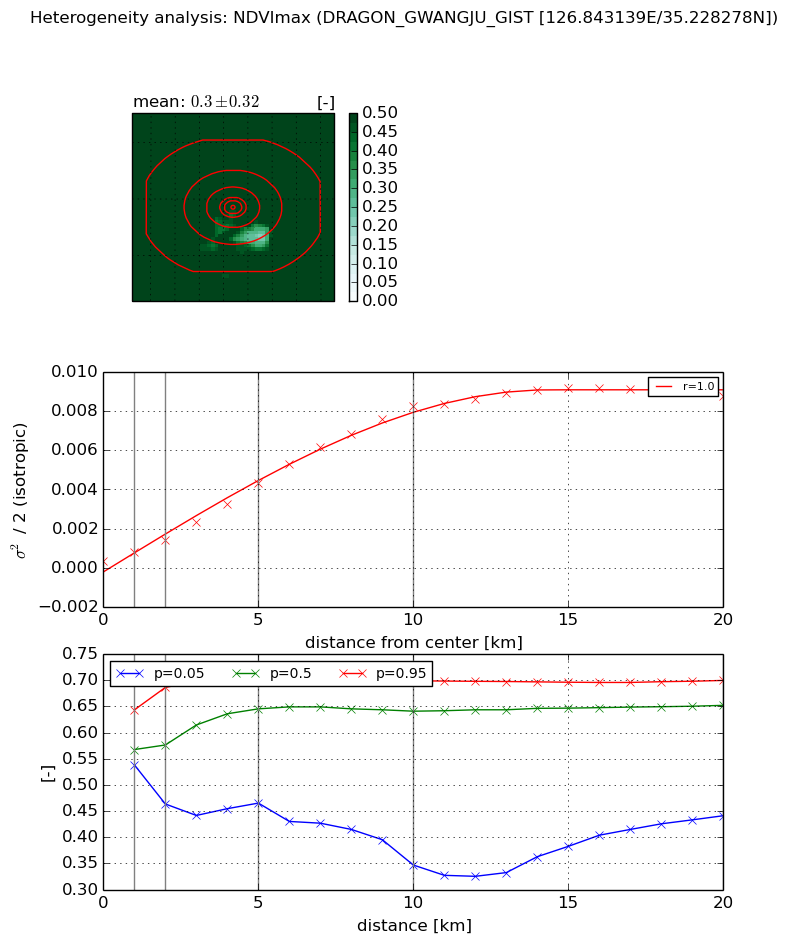
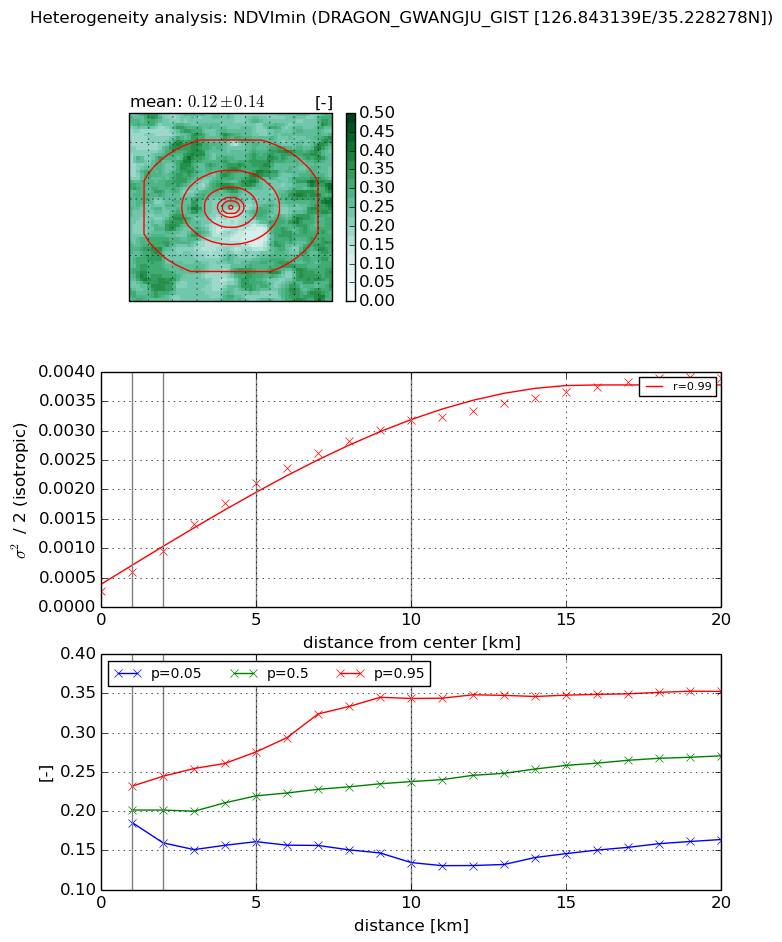
Heterogeneity analysis

The heterogeneity analysis provides information about the spatial and temporal heterogeneity of the site.

Topography


Roman et al. (2009) index


St

3.72675846146

Rcv

0.625389436041

Rse

0.0

Rst

-0.0521035458852

Rsv

-0.127496134226


Height range @ 1km [m]

15

Height range @ 2km [m]

23

Height range @ 5km [m]

51

Height range @ 10km [m]

-999

Height range @ 20km [m]

-999


Variance slope @ 1 km

193

Variance slope @ 2 km

145

Variance slope @ 5 km

95

Variance slope @ 10 km

-999

Variance slope @ 20 km

-999


NDVI (max. NDVI composite)


Roman et al. (2009) index


St

5.09065798124

Rcv

-0.0509851031839

Rse

0.0

Rst

-0.108738224692

Rsv

0.429591454428


NDVI range @ 1km [-]

0.11

NDVI range @ 2km [-]

0.22

NDVI range @ 5km [-]

0.23

NDVI range @ 10km [-]

0.35

NDVI range @ 20km [-]

0.26


Variance slope @ 1 km

0.000461247964345

Variance slope @ 2 km

0.000531749262159

Variance slope @ 5 km

0.000804629980525

Variance slope @ 10 km

0.00084169835193

Variance slope @ 20 km

0.00046087756336


NDVI (min. NDVI composite)I


Roman et al. (2009) index


St

0.417403621334

Rcv

0.0598780717382

Rse

0.0

Rst

-6.15776982915

Rsv

0.969640006238


NDVI range @ 1km [-]

0.05

NDVI range @ 2km [-]

0.08

NDVI range @ 5km [-]

0.11

NDVI range @ 10km [-]

0.21

NDVI range @ 20km [-]

0.19


NDVI slope @ 1 km

0.000322892554455

NDVI slope @ 2 km

0.000344110481524

NDVI slope @ 5 km

0.000376829035767

NDVI slope @ 10 km

0.000298573878692

NDVI slope @ 20 km

0.000174942606195


Temporal stability analysis

+000 deg (BHR)


BHR statistics

Temporal stability [1/decade]:


abs

rel


Weighted least square:

None


Ordinary least square:

None


Probabilities that GCOS criteria is met:

Weighted least square:

None %

Ordinary least square:

None %


DHR statistics

Temporal stability [1/decade]:


abs

rel


Weighted least square:

None


Ordinary least square:

None


Probabilities that GCOS criteria is met:

Weighted least square:

None %

Ordinary least square:

None %


+057/+063 deg (BHR)


BHR statistics

Temporal stability [1/decade]:


abs

rel


Weighted least square:

-99999.0


Ordinary least square:

-99999.0


Probabilities that GCOS criteria is met:

Weighted least square:

-99999.0 %

Ordinary least square:

-99999.0 %


DHR statistics

Temporal stability [1/decade]:


abs

rel


Weighted least square:

-99999.0


Ordinary least square:

-99999.0


Probabilities that GCOS criteria is met:

Weighted least square:

-99999.0 %

Ordinary least square:

-99999.0 %


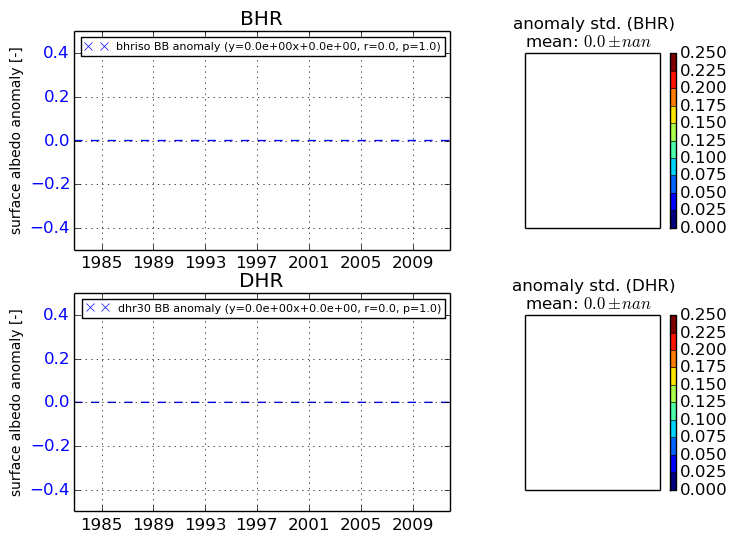
Temporal anomaly analyis

The variance of the temporal anomalies provides an additional measure about the stability of the signal AFTER removal of the mean seasonal cylce.

+000 deg


+057/+063 deg