DRAGON_HANFORD


Location

lon / lat [deg]: -119.6432 / 36.3157

Source network: AERONET


Geostationary surface albedo (GSA) data


“+000”


“+057/+063”


Landcover information (based on ESA CCI landcover data)


Landcover fractions @ 2km distance


Landcover fractions @ 20 km distance


Legend


Distance to open water bodies [km]:

2.57

Distance to urban areas [km]:

0.05


Radius: 1 km

Number of landcover classes:

3

Dominant landcover type:

190: urban areas

Fraction of dominant landcover type [%]:

79.0


Radius: 2 km

Number of landcover classes:

5

Dominant landcover type:

190: urban areas

Fraction of dominant landcover type [%]:

70.0


Radius: 5 km

Number of landcover classes:

4

Dominant landcover type:

10: cropland, rainfed

Fraction of dominant landcover type [%]:

49.0


Radius: 10 km

Number of landcover classes:

4

Dominant landcover type:

10: cropland, rainfed

Fraction of dominant landcover type [%]:

75.0


Radius: 20 km

Number of landcover classes:

5

Dominant landcover type:

10: cropland, rainfed

Fraction of dominant landcover type [%]:

76.0


Disturbances


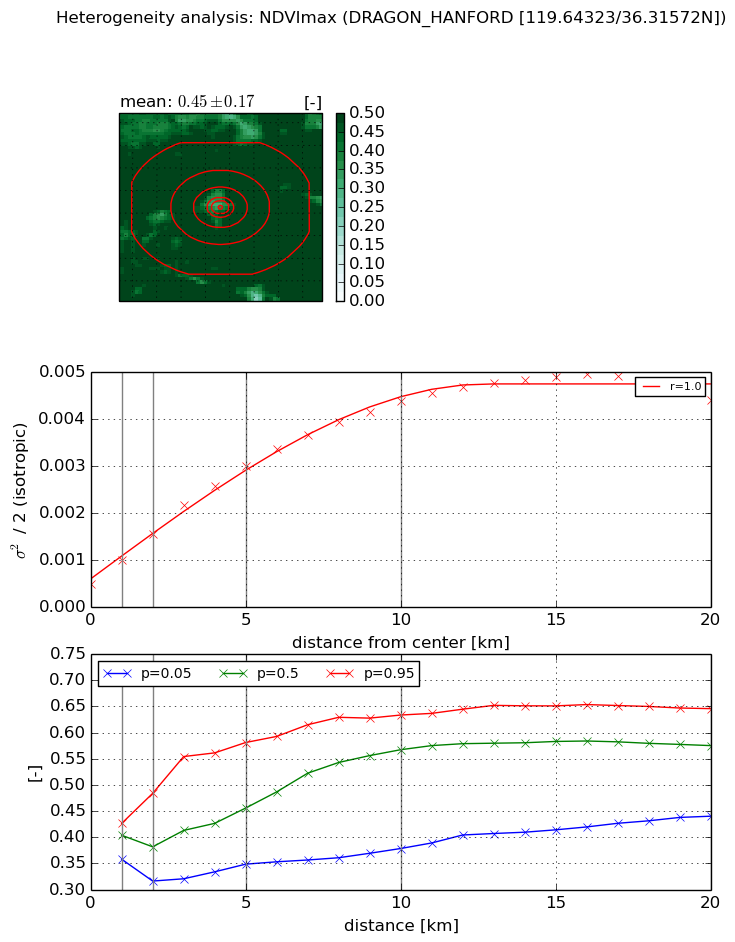
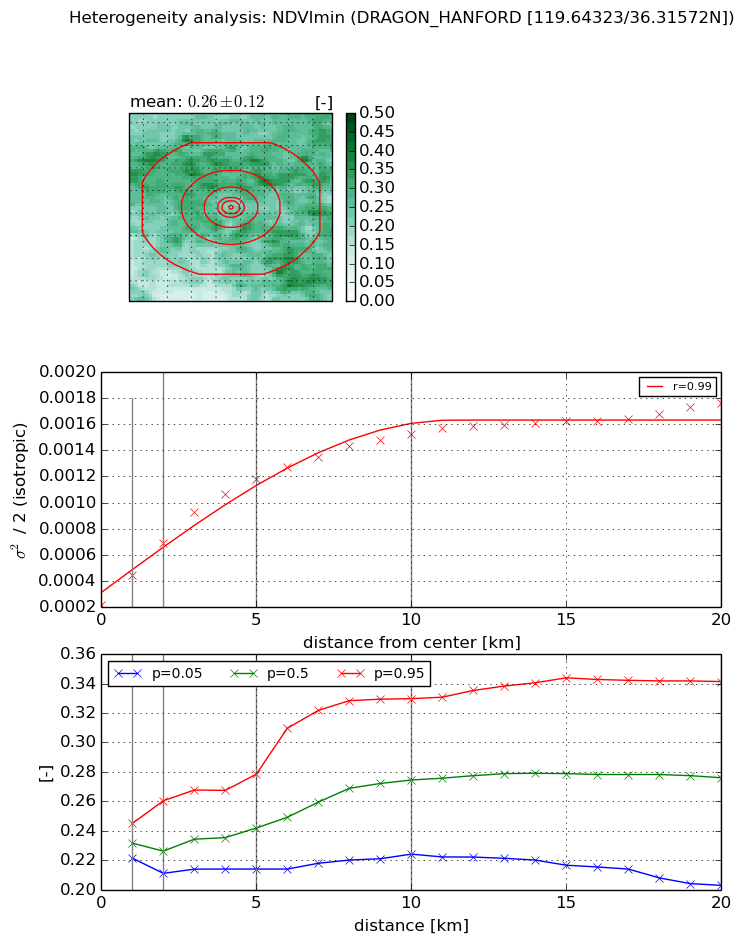
Heterogeneity analysis

The heterogeneity analysis provides information about the spatial and temporal heterogeneity of the site.

Topography


Roman et al. (2009) index


St

6.06246636325

Rcv

0.328271318548

Rse

0.0

Rst

5.38471264693e-10

Rsv

0.166576787319


Height range @ 1km [m]

5

Height range @ 2km [m]

6

Height range @ 5km [m]

9

Height range @ 10km [m]

-999

Height range @ 20km [m]

-999


Variance slope @ 1 km

1

Variance slope @ 2 km

0

Variance slope @ 5 km

1

Variance slope @ 10 km

-999

Variance slope @ 20 km

-999


NDVI (max. NDVI composite)


Roman et al. (2009) index


St

1.58797846452e-07

Rcv

-0.0214227144059

Rse

0.0

Rst

0.24919143043

Rsv

18891943.5877


NDVI range @ 1km [-]

0.07

NDVI range @ 2km [-]

0.17

NDVI range @ 5km [-]

0.23

NDVI range @ 10km [-]

0.26

NDVI range @ 20km [-]

0.21


Variance slope @ 1 km

0.000514578826493

Variance slope @ 2 km

0.000530325971355

Variance slope @ 5 km

0.000511097205789

Variance slope @ 10 km

0.000390067076302

Variance slope @ 20 km

0.000195874323008


NDVI (min. NDVI composite)I


Roman et al. (2009) index


St

1.64080627215

Rcv

0.229574124215

Rse

0.0

Rst

-0.361179332165

Rsv

1.23761595622


NDVI range @ 1km [-]

0.02

NDVI range @ 2km [-]

0.05

NDVI range @ 5km [-]

0.06

NDVI range @ 10km [-]

0.11

NDVI range @ 20km [-]

0.14


NDVI slope @ 1 km

0.000227786933482

NDVI slope @ 2 km

0.000234041841744

NDVI slope @ 5 km

0.000196335615483

NDVI slope @ 10 km

0.000126492753403

NDVI slope @ 20 km

6.22245805707e-05


Temporal stability analysis

+000 deg (BHR)


BHR statistics

Temporal stability [1/decade]:


abs

rel


Weighted least square:

None


Ordinary least square:

None


Probabilities that GCOS criteria is met:

Weighted least square:

None %

Ordinary least square:

None %


DHR statistics

Temporal stability [1/decade]:


abs

rel


Weighted least square:

None


Ordinary least square:

None


Probabilities that GCOS criteria is met:

Weighted least square:

None %

Ordinary least square:

None %


+057/+063 deg (BHR)


BHR statistics

Temporal stability [1/decade]:


abs

rel


Weighted least square:

None


Ordinary least square:

None


Probabilities that GCOS criteria is met:

Weighted least square:

None %

Ordinary least square:

None %


DHR statistics

Temporal stability [1/decade]:


abs

rel


Weighted least square:

None


Ordinary least square:

None


Probabilities that GCOS criteria is met:

Weighted least square:

None %

Ordinary least square:

None %


Temporal anomaly analyis

The variance of the temporal anomalies provides an additional measure about the stability of the signal AFTER removal of the mean seasonal cylce.

+000 deg


+057/+063 deg