DRAGON_HANKUK_UFS


Location

lon / lat [deg]: 127.2658 / 37.3388

Source network: AERONET


Geostationary surface albedo (GSA) data


“+000”


“+057/+063”


Landcover information (based on ESA CCI landcover data)


Landcover fractions @ 2km distance


Landcover fractions @ 20 km distance


Legend


Distance to open water bodies [km]:

7.05

Distance to urban areas [km]:

0.95


Radius: 1 km

Number of landcover classes:

4

Dominant landcover type:

70: Tree cover, needleleaved, evergreen, closed to open (>15%)

Fraction of dominant landcover type [%]:

80.0


Radius: 2 km

Number of landcover classes:

7

Dominant landcover type:

70: Tree cover, needleleaved, evergreen, closed to open (>15%)

Fraction of dominant landcover type [%]:

48.0


Radius: 5 km

Number of landcover classes:

8

Dominant landcover type:

70: Tree cover, needleleaved, evergreen, closed to open (>15%)

Fraction of dominant landcover type [%]:

44.0


Radius: 10 km

Number of landcover classes:

9

Dominant landcover type:

70: Tree cover, needleleaved, evergreen, closed to open (>15%)

Fraction of dominant landcover type [%]:

43.0


Radius: 20 km

Number of landcover classes:

8

Dominant landcover type:

70: Tree cover, needleleaved, evergreen, closed to open (>15%)

Fraction of dominant landcover type [%]:

38.0


Disturbances


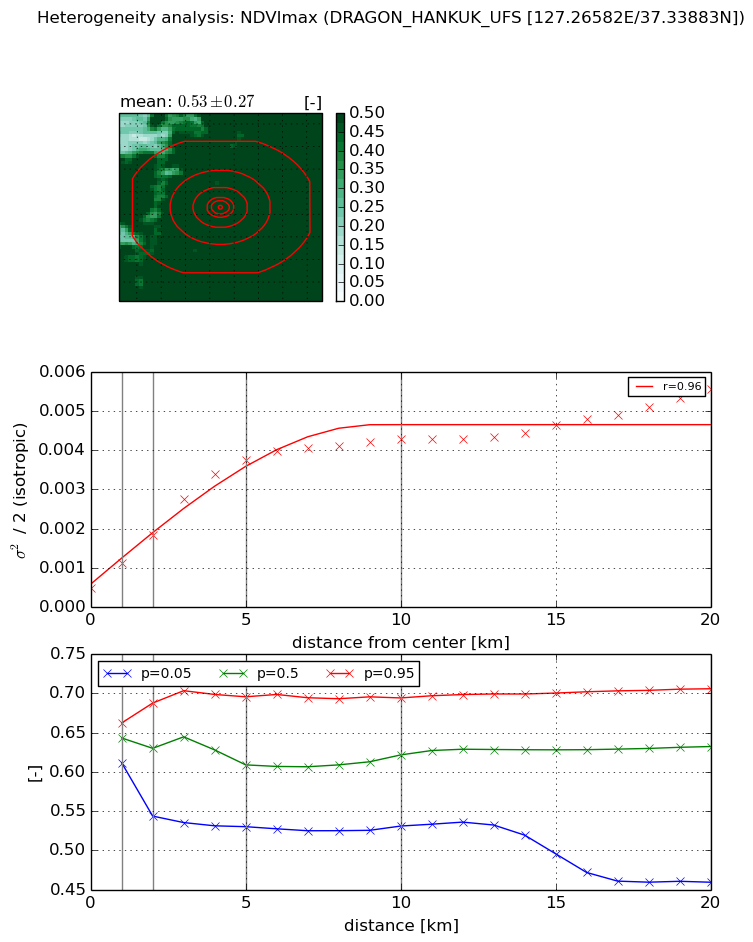
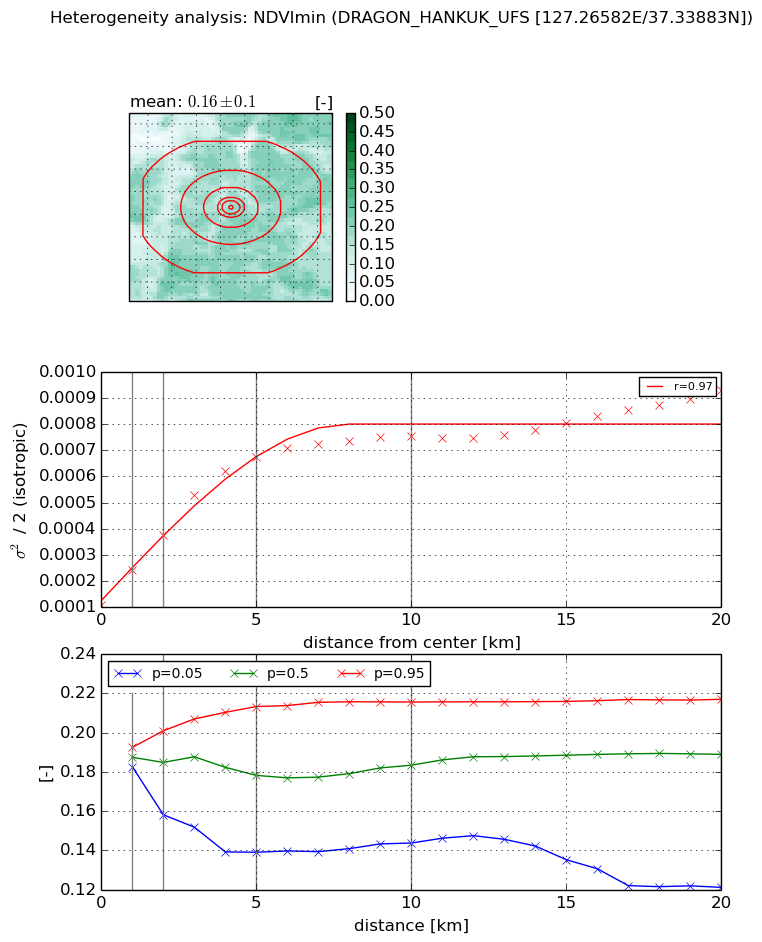
Heterogeneity analysis

The heterogeneity analysis provides information about the spatial and temporal heterogeneity of the site.

Topography


Roman et al. (2009) index


St

12.2485934747

Rcv

0.0173510558461

Rse

0.0

Rst

-0.0782909020599

Rsv

-0.149284123296


Height range @ 1km [m]

181

Height range @ 2km [m]

364

Height range @ 5km [m]

354

Height range @ 10km [m]

-999

Height range @ 20km [m]

-999


Variance slope @ 1 km

4424

Variance slope @ 2 km

4396

Variance slope @ 5 km

3126

Variance slope @ 10 km

-999

Variance slope @ 20 km

-999


NDVI (max. NDVI composite)


Roman et al. (2009) index


St

20.7670241632

Rcv

0.0187519489099

Rse

0.0

Rst

-0.0750031628895

Rsv

0.0507046806301


NDVI range @ 1km [-]

0.05

NDVI range @ 2km [-]

0.14

NDVI range @ 5km [-]

0.17

NDVI range @ 10km [-]

0.16

NDVI range @ 20km [-]

0.25


Variance slope @ 1 km

0.000644837951455

Variance slope @ 2 km

0.000670327748492

Variance slope @ 5 km

0.000686542486316

Variance slope @ 10 km

0.00037601469607

Variance slope @ 20 km

0.000189440325637


NDVI (min. NDVI composite)I


Roman et al. (2009) index


St

3.54051658058

Rcv

0.25833889009

Rse

0.0

Rst

-0.166072080011

Rsv

0.422923008351


NDVI range @ 1km [-]

0.01

NDVI range @ 2km [-]

0.04

NDVI range @ 5km [-]

0.07

NDVI range @ 10km [-]

0.07

NDVI range @ 20km [-]

0.1


NDVI slope @ 1 km

0.000134759112856

NDVI slope @ 2 km

0.000133812569288

NDVI slope @ 5 km

0.00011814394545

NDVI slope @ 10 km

6.1967876485e-05

NDVI slope @ 20 km

2.94639701509e-05


Temporal stability analysis

+000 deg (BHR)


BHR statistics

Temporal stability [1/decade]:


abs

rel


Weighted least square:

None


Ordinary least square:

None


Probabilities that GCOS criteria is met:

Weighted least square:

None %

Ordinary least square:

None %


DHR statistics

Temporal stability [1/decade]:


abs

rel


Weighted least square:

None


Ordinary least square:

None


Probabilities that GCOS criteria is met:

Weighted least square:

None %

Ordinary least square:

None %


+057/+063 deg (BHR)


BHR statistics

Temporal stability [1/decade]:


abs

rel


Weighted least square:

-99999.0


Ordinary least square:

-99999.0


Probabilities that GCOS criteria is met:

Weighted least square:

-99999.0 %

Ordinary least square:

-99999.0 %


DHR statistics

Temporal stability [1/decade]:


abs

rel


Weighted least square:

-99999.0


Ordinary least square:

-99999.0


Probabilities that GCOS criteria is met:

Weighted least square:

-99999.0 %

Ordinary least square:

-99999.0 %


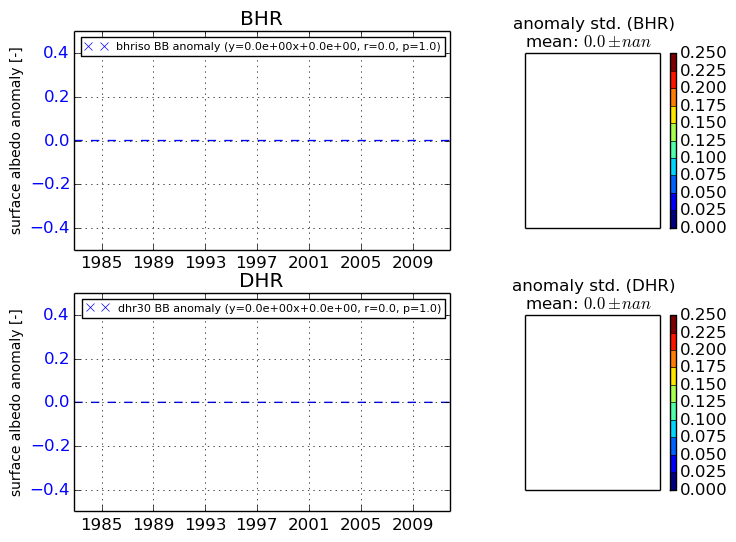
Temporal anomaly analyis

The variance of the temporal anomalies provides an additional measure about the stability of the signal AFTER removal of the mean seasonal cylce.

+000 deg


+057/+063 deg