DRAGON_KOHRIYAMA


Location

lon / lat [deg]: 140.3829 / 37.361

Source network: AERONET


Geostationary surface albedo (GSA) data


“+000”


“+057/+063”


Landcover information (based on ESA CCI landcover data)


Landcover fractions @ 2km distance


Landcover fractions @ 20 km distance


Legend


Distance to open water bodies [km]:

11.71

Distance to urban areas [km]:

0.17


Radius: 1 km

Number of landcover classes:

2

Dominant landcover type:

190: urban areas

Fraction of dominant landcover type [%]:

92.0


Radius: 2 km

Number of landcover classes:

2

Dominant landcover type:

190: urban areas

Fraction of dominant landcover type [%]:

90.0


Radius: 5 km

Number of landcover classes:

4

Dominant landcover type:

190: urban areas

Fraction of dominant landcover type [%]:

56.0


Radius: 10 km

Number of landcover classes:

5

Dominant landcover type:

11: cropland, rainfed, herbaceous cover

Fraction of dominant landcover type [%]:

37.0


Radius: 20 km

Number of landcover classes:

5

Dominant landcover type:

70: Tree cover, needleleaved, evergreen, closed to open (>15%)

Fraction of dominant landcover type [%]:

35.0


Disturbances


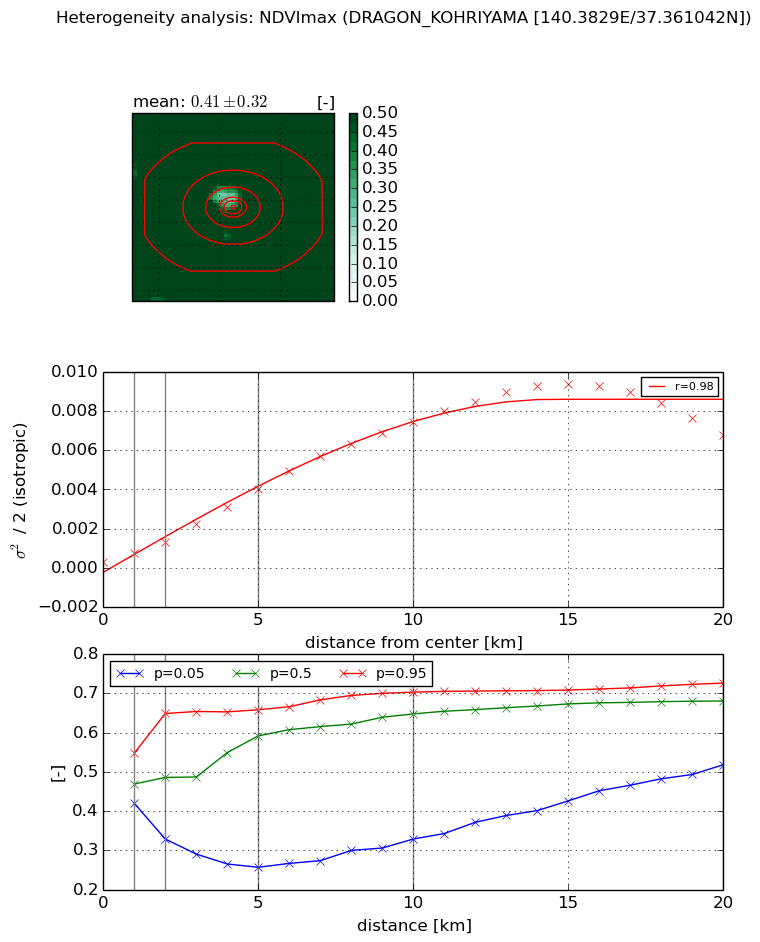
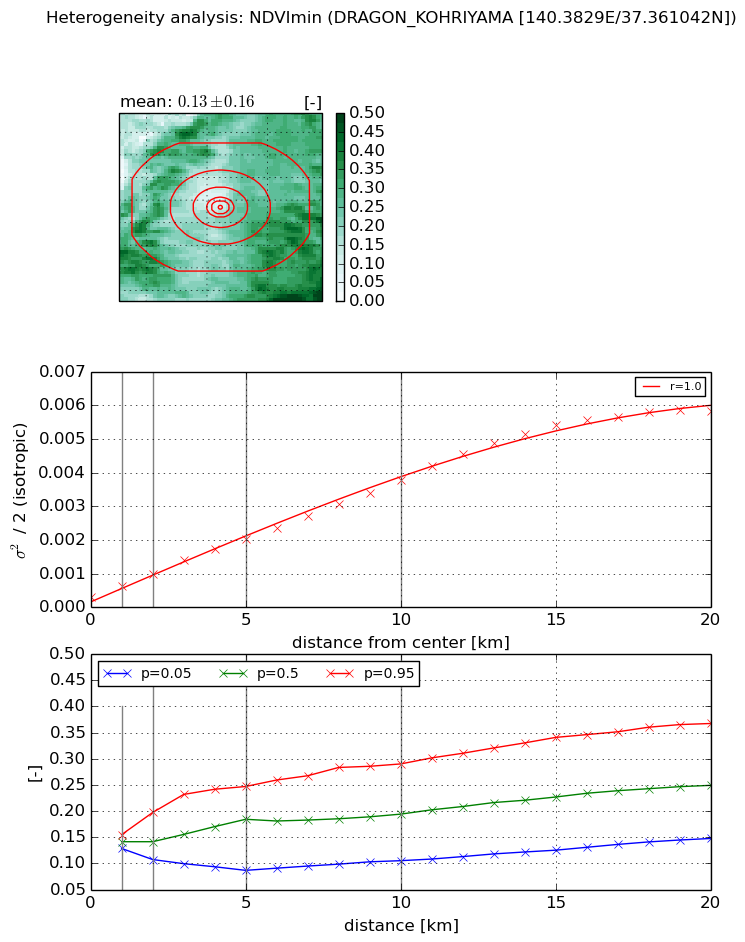
Heterogeneity analysis

The heterogeneity analysis provides information about the spatial and temporal heterogeneity of the site.

Topography


Roman et al. (2009) index


St

2.84648031102

Rcv

0.490462524831

Rse

0.0

Rst

0.110971224579

Rsv

0.452499414429


Height range @ 1km [m]

8

Height range @ 2km [m]

14

Height range @ 5km [m]

51

Height range @ 10km [m]

-999

Height range @ 20km [m]

-999


Variance slope @ 1 km

102

Variance slope @ 2 km

88

Variance slope @ 5 km

81

Variance slope @ 10 km

-999

Variance slope @ 20 km

-999


NDVI (max. NDVI composite)


Roman et al. (2009) index


St

4.69523857971

Rcv

0.0645861292126

Rse

0.0

Rst

-0.0622208453281

Rsv

0.512138192796


NDVI range @ 1km [-]

0.13

NDVI range @ 2km [-]

0.32

NDVI range @ 5km [-]

0.4

NDVI range @ 10km [-]

0.37

NDVI range @ 20km [-]

0.21


Variance slope @ 1 km

0.000438929879581

Variance slope @ 2 km

0.000500202191909

Variance slope @ 5 km

0.000762272059424

Variance slope @ 10 km

0.000762614587691

Variance slope @ 20 km

0.000424198910219


NDVI (min. NDVI composite)I


Roman et al. (2009) index


St

8.68209740197e-08

Rcv

0.105067522992

Rse

0.0

Rst

0.170329674542

Rsv

34553862.2431


NDVI range @ 1km [-]

0.03

NDVI range @ 2km [-]

0.09

NDVI range @ 5km [-]

0.16

NDVI range @ 10km [-]

0.19

NDVI range @ 20km [-]

0.22


NDVI slope @ 1 km

0.000327051650645

NDVI slope @ 2 km

0.000336723902264

NDVI slope @ 5 km

0.000353850382189

NDVI slope @ 10 km

0.000345666833474

NDVI slope @ 20 km

0.000301542695963


Temporal stability analysis

+000 deg (BHR)


BHR statistics

Temporal stability [1/decade]:


abs

rel


Weighted least square:

None


Ordinary least square:

None


Probabilities that GCOS criteria is met:

Weighted least square:

None %

Ordinary least square:

None %


DHR statistics

Temporal stability [1/decade]:


abs

rel


Weighted least square:

None


Ordinary least square:

None


Probabilities that GCOS criteria is met:

Weighted least square:

None %

Ordinary least square:

None %


+057/+063 deg (BHR)


BHR statistics

Temporal stability [1/decade]:


abs

rel


Weighted least square:

None


Ordinary least square:

None


Probabilities that GCOS criteria is met:

Weighted least square:

None %

Ordinary least square:

None %


DHR statistics

Temporal stability [1/decade]:


abs

rel


Weighted least square:

None


Ordinary least square:

None


Probabilities that GCOS criteria is met:

Weighted least square:

None %

Ordinary least square:

None %


Temporal anomaly analyis

The variance of the temporal anomalies provides an additional measure about the stability of the signal AFTER removal of the mean seasonal cylce.

+000 deg


+057/+063 deg