DRAGON_KYOTO


Location

lon / lat [deg]: 135.781 / 35.026

Source network: AERONET


Geostationary surface albedo (GSA) data


“+000”


“+057/+063”


Landcover information (based on ESA CCI landcover data)


Landcover fractions @ 2km distance


Landcover fractions @ 20 km distance


Legend


Distance to open water bodies [km]:

5.73

Distance to urban areas [km]:

0.1


Radius: 1 km

Number of landcover classes:

1

Dominant landcover type:

190: urban areas

Fraction of dominant landcover type [%]:

100.0


Radius: 2 km

Number of landcover classes:

1

Dominant landcover type:

190: urban areas

Fraction of dominant landcover type [%]:

100.0


Radius: 5 km

Number of landcover classes:

2

Dominant landcover type:

190: urban areas

Fraction of dominant landcover type [%]:

94.0


Radius: 10 km

Number of landcover classes:

8

Dominant landcover type:

190: urban areas

Fraction of dominant landcover type [%]:

59.0


Radius: 20 km

Number of landcover classes:

8

Dominant landcover type:

70: Tree cover, needleleaved, evergreen, closed to open (>15%)

Fraction of dominant landcover type [%]:

37.0


Disturbances


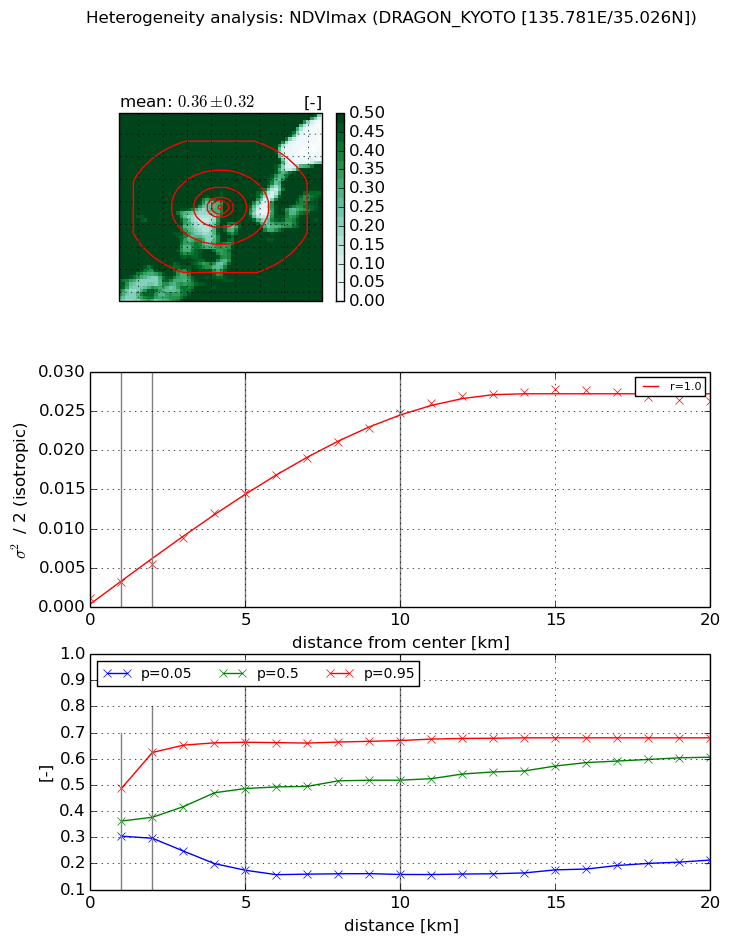
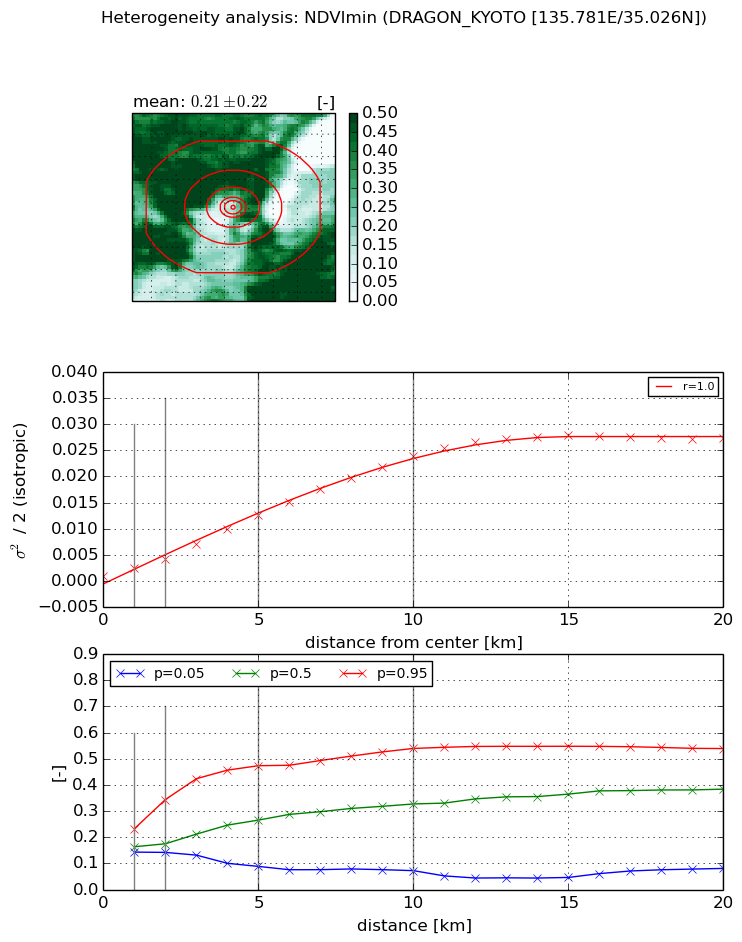
Heterogeneity analysis

The heterogeneity analysis provides information about the spatial and temporal heterogeneity of the site.

Topography


Roman et al. (2009) index


St

2.79506070155

Rcv

0.0741458472443

Rse

0.0

Rst

-0.000175703789867

Rsv

-0.999000398051


Height range @ 1km [m]

40

Height range @ 2km [m]

103

Height range @ 5km [m]

342

Height range @ 10km [m]

-999

Height range @ 20km [m]

-999


Variance slope @ 1 km

2372

Variance slope @ 2 km

2781

Variance slope @ 5 km

3002

Variance slope @ 10 km

-999

Variance slope @ 20 km

-999


NDVI (max. NDVI composite)


Roman et al. (2009) index


St

2.91580489424e-05

Rcv

0.0943166215835

Rse

0.0

Rst

0.177237209014

Rsv

102887.270954


NDVI range @ 1km [-]

0.18

NDVI range @ 2km [-]

0.33

NDVI range @ 5km [-]

0.49

NDVI range @ 10km [-]

0.51

NDVI range @ 20km [-]

0.47


Variance slope @ 1 km

0.00194273094986

Variance slope @ 2 km

0.00212571652195

Variance slope @ 5 km

0.00275818910265

Variance slope @ 10 km

0.00243732735779

Variance slope @ 20 km

0.0013040605228


NDVI (min. NDVI composite)I


Roman et al. (2009) index


St

1.9635452067e-06

Rcv

0.0611312742361

Rse

0.0

Rst

0.142168252632

Rsv

1527848.50106


NDVI range @ 1km [-]

0.09

NDVI range @ 2km [-]

0.2

NDVI range @ 5km [-]

0.39

NDVI range @ 10km [-]

0.47

NDVI range @ 20km [-]

0.46


NDVI slope @ 1 km

0.00148051077763

NDVI slope @ 2 km

0.00164729463686

NDVI slope @ 5 km

0.00238466499526

NDVI slope @ 10 km

0.00241192737523

NDVI slope @ 20 km

0.0014189155304


Temporal stability analysis

+000 deg (BHR)


BHR statistics

Temporal stability [1/decade]:


abs

rel


Weighted least square:

None


Ordinary least square:

None


Probabilities that GCOS criteria is met:

Weighted least square:

None %

Ordinary least square:

None %


DHR statistics

Temporal stability [1/decade]:


abs

rel


Weighted least square:

None


Ordinary least square:

None


Probabilities that GCOS criteria is met:

Weighted least square:

None %

Ordinary least square:

None %


+057/+063 deg (BHR)


BHR statistics

Temporal stability [1/decade]:


abs

rel


Weighted least square:

-99999.0


Ordinary least square:

-99999.0


Probabilities that GCOS criteria is met:

Weighted least square:

-99999.0 %

Ordinary least square:

-99999.0 %


DHR statistics

Temporal stability [1/decade]:


abs

rel


Weighted least square:

-99999.0


Ordinary least square:

-99999.0


Probabilities that GCOS criteria is met:

Weighted least square:

-99999.0 %

Ordinary least square:

-99999.0 %


Temporal anomaly analyis

The variance of the temporal anomalies provides an additional measure about the stability of the signal AFTER removal of the mean seasonal cylce.

+000 deg


+057/+063 deg