DRAGON_KYUNGIL_UNIV


Location

lon / lat [deg]: 128.8236 / 36.0717

Source network: AERONET


Geostationary surface albedo (GSA) data


“+000”


“+057/+063”


Landcover information (based on ESA CCI landcover data)


Landcover fractions @ 2km distance


Landcover fractions @ 20 km distance


Legend


Distance to open water bodies [km]:

1.53

Distance to urban areas [km]:

1.92


Radius: 1 km

Number of landcover classes:

2

Dominant landcover type:

70: Tree cover, needleleaved, evergreen, closed to open (>15%)

Fraction of dominant landcover type [%]:

87.0


Radius: 2 km

Number of landcover classes:

6

Dominant landcover type:

70: Tree cover, needleleaved, evergreen, closed to open (>15%)

Fraction of dominant landcover type [%]:

87.0


Radius: 5 km

Number of landcover classes:

10

Dominant landcover type:

70: Tree cover, needleleaved, evergreen, closed to open (>15%)

Fraction of dominant landcover type [%]:

60.0


Radius: 10 km

Number of landcover classes:

9

Dominant landcover type:

70: Tree cover, needleleaved, evergreen, closed to open (>15%)

Fraction of dominant landcover type [%]:

44.0


Radius: 20 km

Number of landcover classes:

10

Dominant landcover type:

70: Tree cover, needleleaved, evergreen, closed to open (>15%)

Fraction of dominant landcover type [%]:

39.0


Disturbances


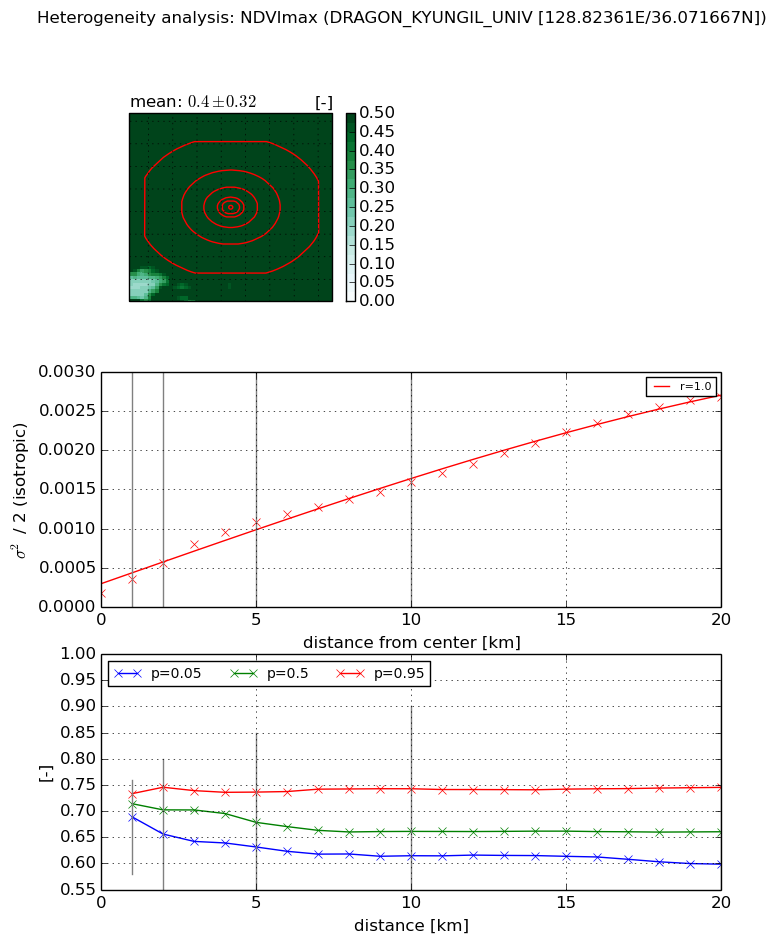
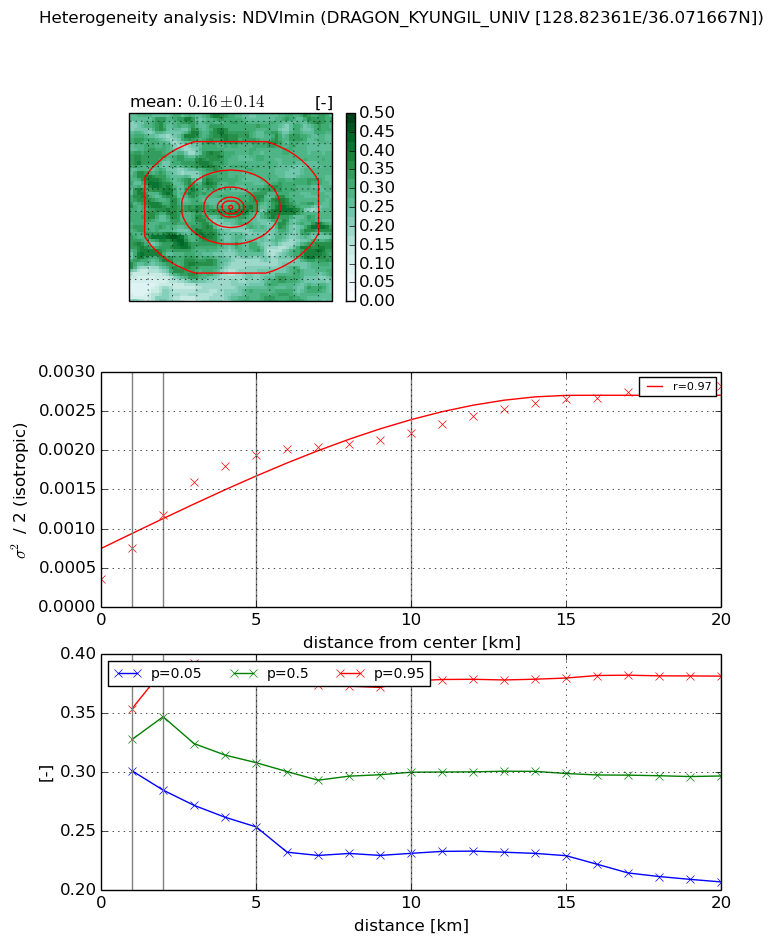
Heterogeneity analysis

The heterogeneity analysis provides information about the spatial and temporal heterogeneity of the site.

Topography


Roman et al. (2009) index


St

0.632618169317

Rcv

0.143018728796

Rse

0.0

Rst

1.41466329583e-07

Rsv

4.59917815395


Height range @ 1km [m]

283

Height range @ 2km [m]

371

Height range @ 5km [m]

561

Height range @ 10km [m]

-999

Height range @ 20km [m]

-999


Variance slope @ 1 km

5513

Variance slope @ 2 km

6106

Variance slope @ 5 km

6349

Variance slope @ 10 km

-999

Variance slope @ 20 km

-999


NDVI (max. NDVI composite)


Roman et al. (2009) index


St

2.00961195553e-07

Rcv

0.0674622465655

Rse

0.0

Rst

0.208242589972

Rsv

14928254.862


NDVI range @ 1km [-]

0.04

NDVI range @ 2km [-]

0.09

NDVI range @ 5km [-]

0.1

NDVI range @ 10km [-]

0.13

NDVI range @ 20km [-]

0.15


Variance slope @ 1 km

0.000174496336801

Variance slope @ 2 km

0.000191133402763

Variance slope @ 5 km

0.000187645449409

Variance slope @ 10 km

0.000137409747336

Variance slope @ 20 km

0.000121786479157


NDVI (min. NDVI composite)I


Roman et al. (2009) index


St

9.23602506952

Rcv

0.0890742984497

Rse

0.0

Rst

0.0751313335296

Rsv

-0.160609424002


NDVI range @ 1km [-]

0.05

NDVI range @ 2km [-]

0.1

NDVI range @ 5km [-]

0.13

NDVI range @ 10km [-]

0.15

NDVI range @ 20km [-]

0.17


NDVI slope @ 1 km

0.000392779970437

NDVI slope @ 2 km

0.000406789950974

NDVI slope @ 5 km

0.000329223965623

NDVI slope @ 10 km

0.000169468672495

NDVI slope @ 20 km

0.000100977723483


Temporal stability analysis

+000 deg (BHR)


BHR statistics

Temporal stability [1/decade]:


abs

rel


Weighted least square:

None


Ordinary least square:

None


Probabilities that GCOS criteria is met:

Weighted least square:

None %

Ordinary least square:

None %


DHR statistics

Temporal stability [1/decade]:


abs

rel


Weighted least square:

None


Ordinary least square:

None


Probabilities that GCOS criteria is met:

Weighted least square:

None %

Ordinary least square:

None %


+057/+063 deg (BHR)


BHR statistics

Temporal stability [1/decade]:


abs

rel


Weighted least square:

-99999.0


Ordinary least square:

-99999.0


Probabilities that GCOS criteria is met:

Weighted least square:

-99999.0 %

Ordinary least square:

-99999.0 %


DHR statistics

Temporal stability [1/decade]:


abs

rel


Weighted least square:

-99999.0


Ordinary least square:

-99999.0


Probabilities that GCOS criteria is met:

Weighted least square:

-99999.0 %

Ordinary least square:

-99999.0 %


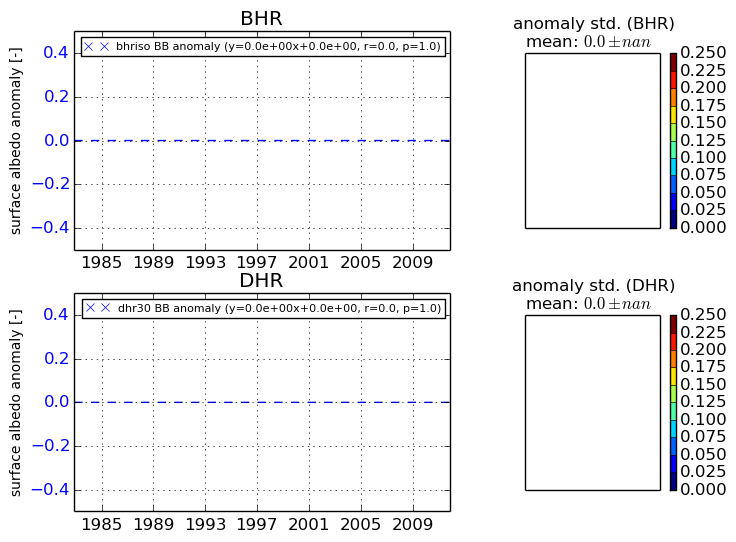
Temporal anomaly analyis

The variance of the temporal anomalies provides an additional measure about the stability of the signal AFTER removal of the mean seasonal cylce.

+000 deg


+057/+063 deg