DRAGON_LAUMD


Location

lon / lat [deg]: -76.8592 / 39.1428

Source network: AERONET


Geostationary surface albedo (GSA) data


“+000”


“+057/+063”


Landcover information (based on ESA CCI landcover data)


Landcover fractions @ 2km distance


Landcover fractions @ 20 km distance


Legend


Distance to open water bodies [km]:

1.66

Distance to urban areas [km]:

0.05


Radius: 1 km

Number of landcover classes:

3

Dominant landcover type:

130: grassland

Fraction of dominant landcover type [%]:

63.0


Radius: 2 km

Number of landcover classes:

7

Dominant landcover type:

190: urban areas

Fraction of dominant landcover type [%]:

44.0


Radius: 5 km

Number of landcover classes:

6

Dominant landcover type:

190: urban areas

Fraction of dominant landcover type [%]:

66.0


Radius: 10 km

Number of landcover classes:

6

Dominant landcover type:

190: urban areas

Fraction of dominant landcover type [%]:

63.0


Radius: 20 km

Number of landcover classes:

7

Dominant landcover type:

190: urban areas

Fraction of dominant landcover type [%]:

58.0


Disturbances


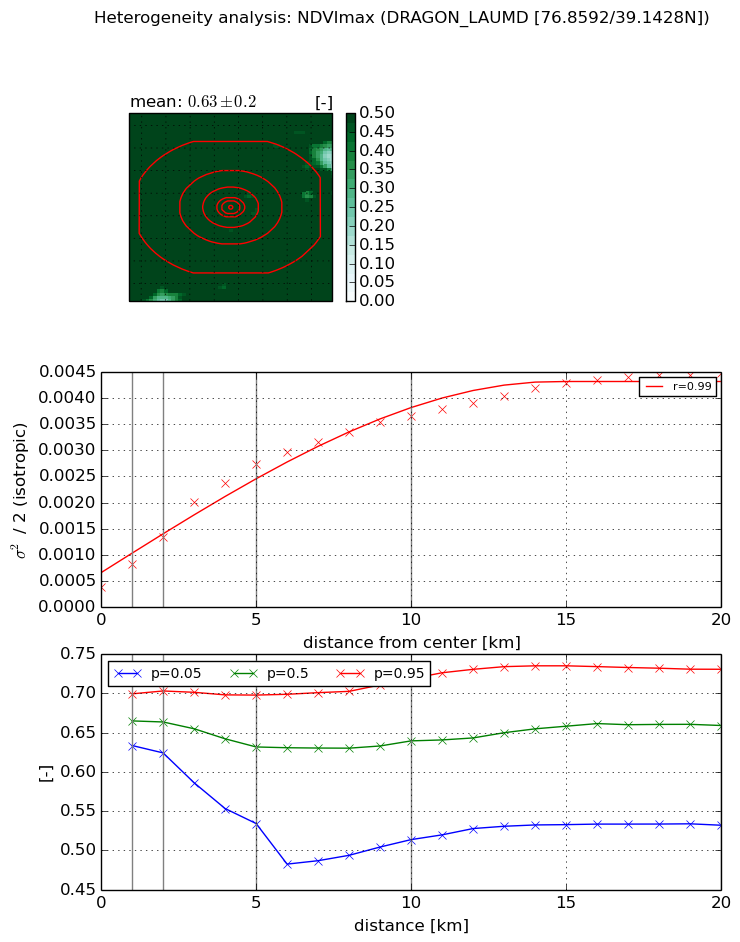
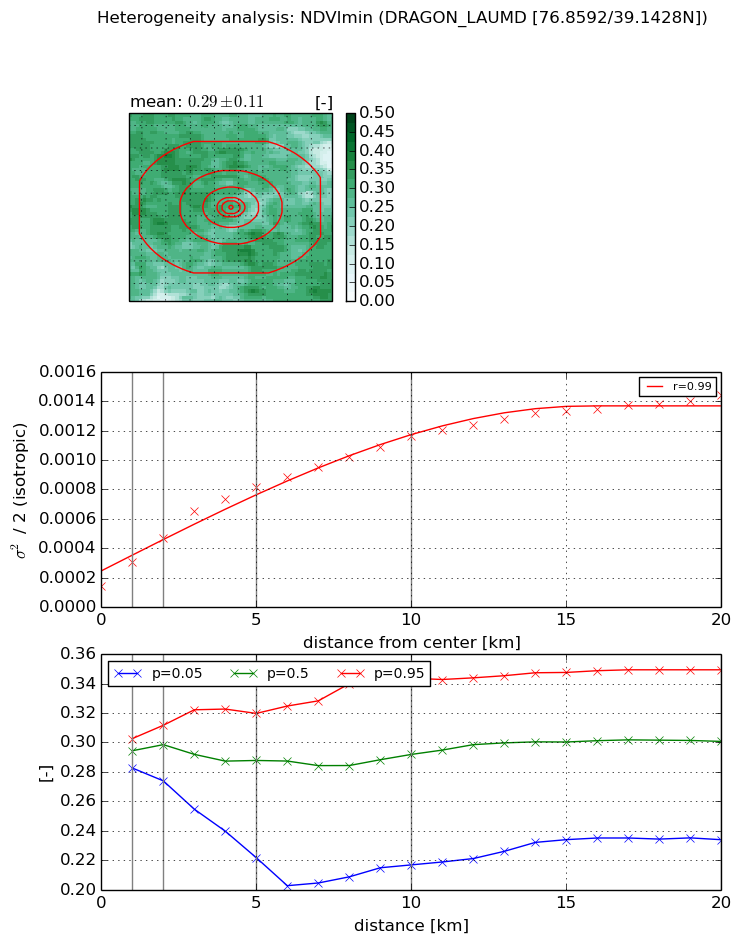
Heterogeneity analysis

The heterogeneity analysis provides information about the spatial and temporal heterogeneity of the site.

Topography


Roman et al. (2009) index


St

1.85490432073

Rcv

0.62107540353

Rse

0.0

Rst

7.33411665764e-08

Rsv

-0.996258617658


Height range @ 1km [m]

23

Height range @ 2km [m]

40

Height range @ 5km [m]

74

Height range @ 10km [m]

-999

Height range @ 20km [m]

-999


Variance slope @ 1 km

101

Variance slope @ 2 km

90

Variance slope @ 5 km

96

Variance slope @ 10 km

-999

Variance slope @ 20 km

-999


NDVI (max. NDVI composite)


Roman et al. (2009) index


St

2.43229970359

Rcv

0.615645514335

Rse

0.0

Rst

-0.355327754591

Rsv

-0.262427366517


NDVI range @ 1km [-]

0.07

NDVI range @ 2km [-]

0.08

NDVI range @ 5km [-]

0.16

NDVI range @ 10km [-]

0.21

NDVI range @ 20km [-]

0.2


Variance slope @ 1 km

0.00044471163199

Variance slope @ 2 km

0.000479766539297

Variance slope @ 5 km

0.000488062448347

Variance slope @ 10 km

0.000328254334581

Variance slope @ 20 km

0.000186167798779


NDVI (min. NDVI composite)I


Roman et al. (2009) index


St

1.88543175955

Rcv

0.497962778738

Rse

0.0

Rst

-0.0931847458028

Rsv

-0.999999959216


NDVI range @ 1km [-]

0.02

NDVI range @ 2km [-]

0.04

NDVI range @ 5km [-]

0.1

NDVI range @ 10km [-]

0.13

NDVI range @ 20km [-]

0.12


NDVI slope @ 1 km

0.0001588088579

NDVI slope @ 2 km

0.000163845849001

NDVI slope @ 5 km

0.00013824335983

NDVI slope @ 10 km

9.62773190321e-05

NDVI slope @ 20 km

5.80201858757e-05


Temporal stability analysis

+000 deg (BHR)


BHR statistics

Temporal stability [1/decade]:


abs

rel


Weighted least square:

-99999.0


Ordinary least square:

-99999.0


Probabilities that GCOS criteria is met:

Weighted least square:

-99999.0 %

Ordinary least square:

-99999.0 %


DHR statistics

Temporal stability [1/decade]:


abs

rel


Weighted least square:

-99999.0


Ordinary least square:

-99999.0


Probabilities that GCOS criteria is met:

Weighted least square:

-99999.0 %

Ordinary least square:

-99999.0 %


+057/+063 deg (BHR)


BHR statistics

Temporal stability [1/decade]:


abs

rel


Weighted least square:

None


Ordinary least square:

None


Probabilities that GCOS criteria is met:

Weighted least square:

None %

Ordinary least square:

None %


DHR statistics

Temporal stability [1/decade]:


abs

rel


Weighted least square:

None


Ordinary least square:

None


Probabilities that GCOS criteria is met:

Weighted least square:

None %

Ordinary least square:

None %


Temporal anomaly analyis

The variance of the temporal anomalies provides an additional measure about the stability of the signal AFTER removal of the mean seasonal cylce.

+000 deg


+057/+063 deg